Narrowband, Part Two
By Jon Engelsman
September 18, 2020
Regarding an exploratory look into the inner workings of GroundWork, a web-based segmentation labeling tool.
Part One covers my experience using GroundWork in a competition that involved labelling cloud pixels in satellite imagery.
GroundWork
Launched in April 2020, Azavea’s GroundWork is a web-based segmentation labeling tool designed to easily and efficiently create training data sets that can be used to train machine learning models. It allows users to set up and define their own labeling projects, from uploading raster imagery source data to defining the segmentation categories to be labeled.
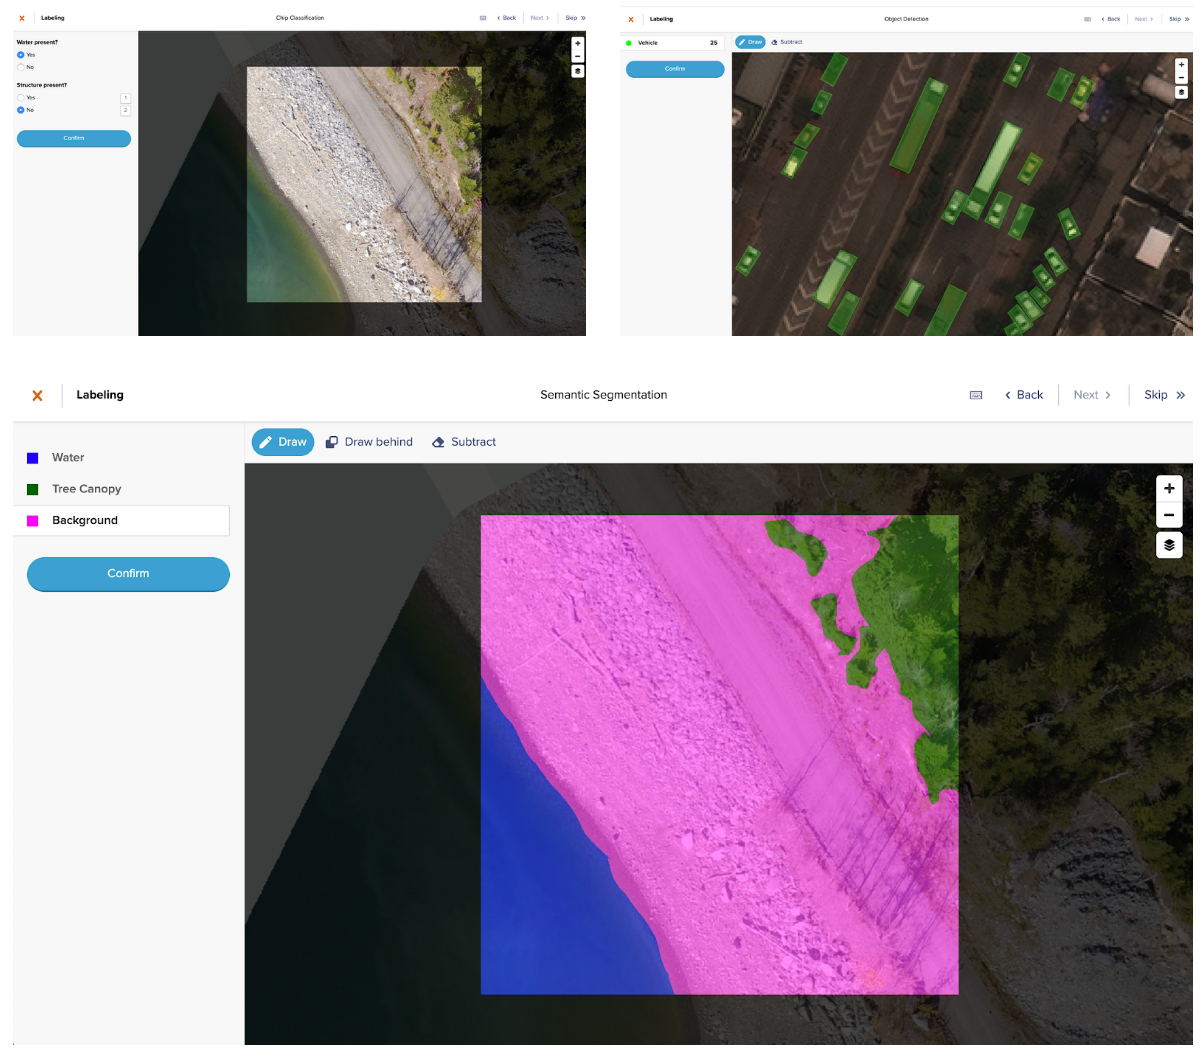 Image: Azavea
The GroundWork application is powered on the back-end by Raster Foundry, “a web app and API that helps anyone find, combine, and analyze geospatial data at any scale, and then share it on the web”, which Azavea launched back in 2017.
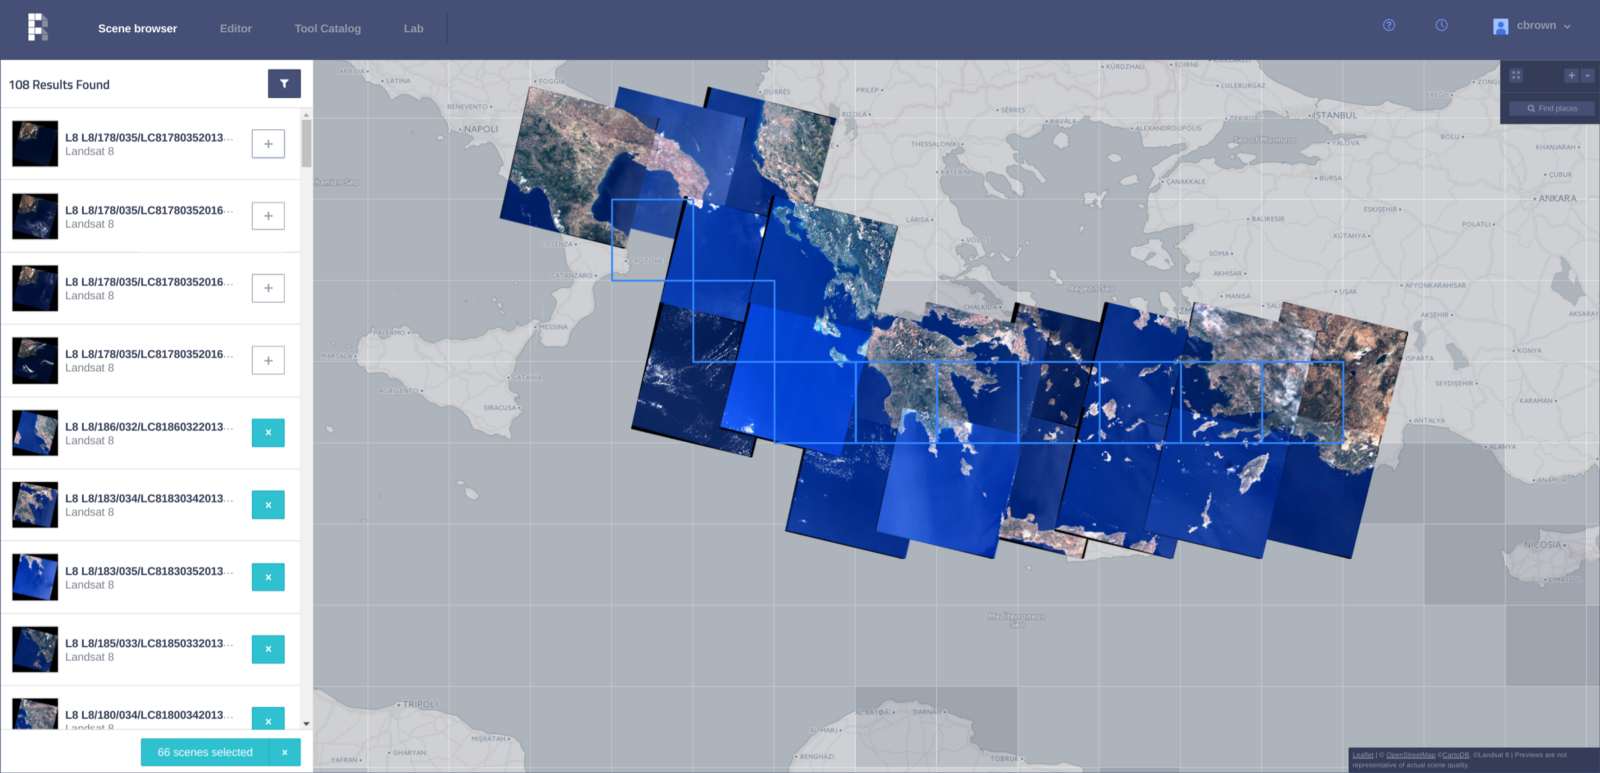 Image: Azavea
As the only tool designed specifically for geospatial imagery, GroundWork enables you to retain any spatial context encoded within the image. Creating your first project is simple. First, determine the project type: object detection, semantic segmentation or image (or chip) classification. Then, you just upload or drop in the url for your image, and the application converts your .tiff or .geojson to a Cloud-Optimized GeoTiff (COG) and breaks it up into tasks, which are 512×512 pixels each. Each task can be labeled individually according to classes you choose. It’s that easy!
Azavea
I started using GroundWork during a data labeling contest as part of the first ever Cloud Native Geospatial Outreach Day, an experience I cover in more detail in Part One. During that work, I was impressed by the overall experience of using GroundWork and wanted to take a closer at how it worked behind the scenes, namely page progressions and data request made to its supporting API.
The GroundWork application is fully built on top of the open-source Raster Foundry API, which you can learn more about (or even deploy yourself) via their GitHub page.
The following post steps through some of the main pages that a user might see when using GroundWork. For each page, I take a closer look at some network calls that are going on behind the scenes to drive the imagery labeling process. The top headings of the following sections refer to specific pages you’ll navigate during the GroundWork labelling workflow, while each subheading refers to a notable action or network call that occurs on that page.
Landing Page
The GroundWork landing page is clean and simple. There’s no other tool like it that’s publicly available as far as I know.
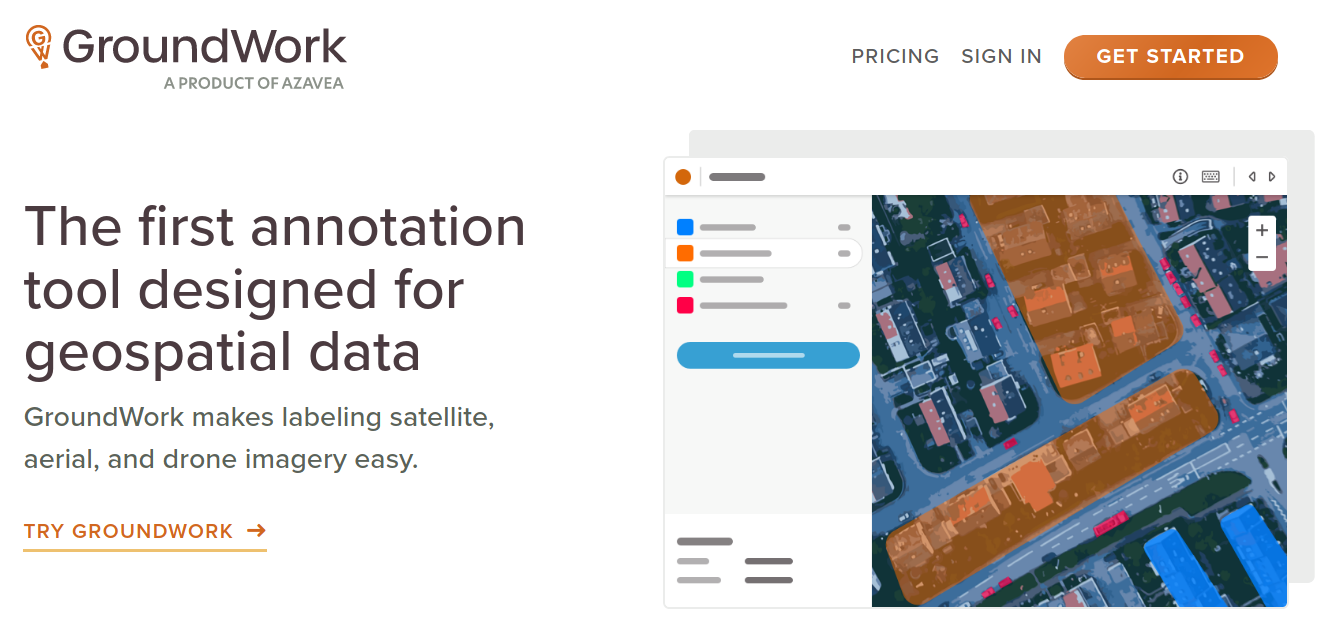 Image: GroundWork
Some well-designed icons highlight the core services that GroundWork offers. The last item, “Cloud-native architecture”, reiterates the fact that imagery is stored as Cloud-Optimized GeoTiff’s (COG’s) but also includes a note that labels are stored as GeoJSON. This an important note which we’ll explore a bit as we get into the back-end services of the tool.
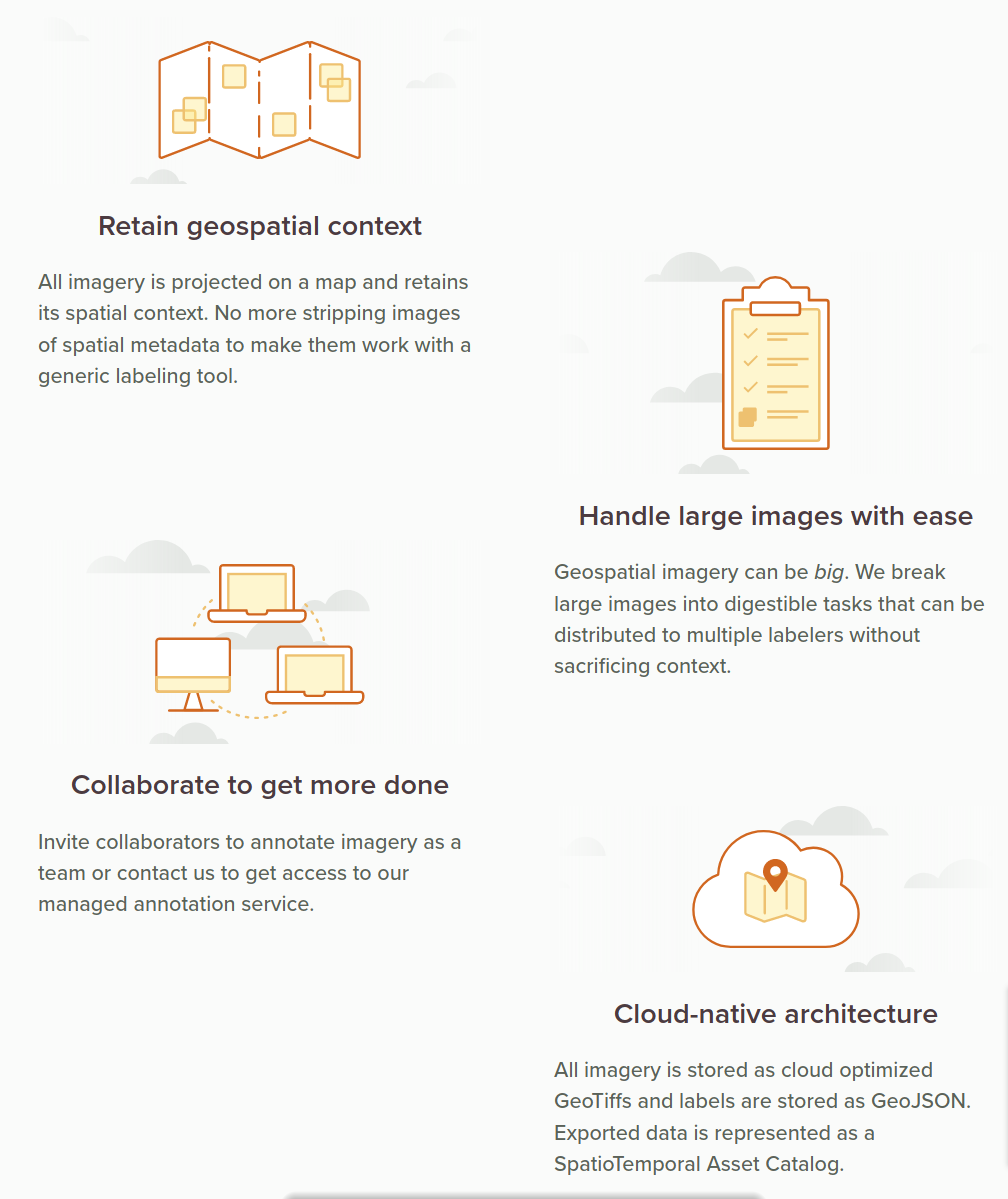 Image: GroundWork
Login
Signing in to GroundWork redirects you to an
Auth0 Universal Login page, hosted at raster-foundry.auth0.com.
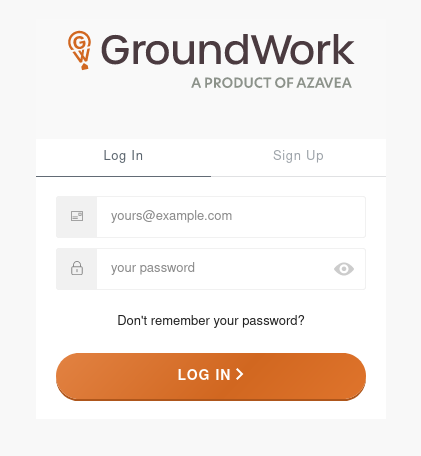 Image: GroundWork
It looks to be using OAuth2 authentication which attaches a Bearer Token (valid for 24 hours) to every subsequent API request. Successfully signing in to Auth0 brings you to your project list.
Project List
The project list is your user account’s home base for all of the labelling projects that have been assigned to you in GroundWork. It shows a paginated list of projects with summary tiles for eight projects listed up front.
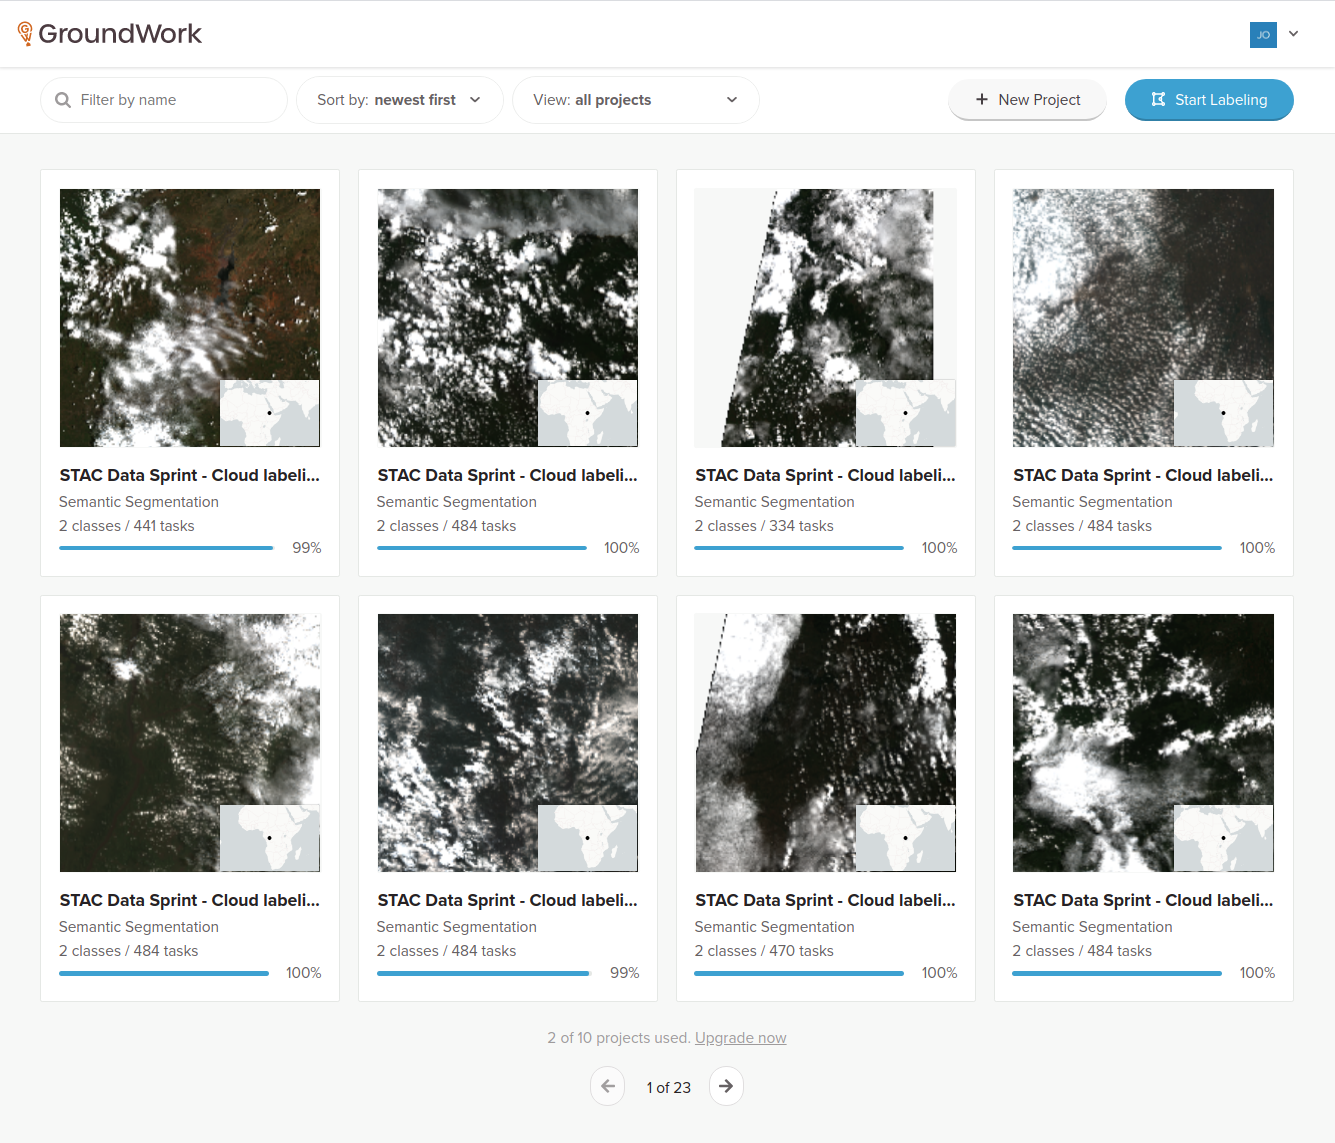 Image: GroundWork
On page load, a handful of interesting network calls happen to create this page and request data needed for possible user interactions. Some of the more interesting ones are discussed here.
Random
A request is made for a random, unlabeled task.
https://app.rasterfoundry.com/api/tasks/random?search=&ownershipType=all&status=UNLABELED
Presumably, this random task could be in any of the projects that are assigned to the user. The response is a GeoJSON feature defining the geometry and metadata of a task, which is then most likely used for the “Start Labeling” button click event to take you to a random task page.
{
    "id": "{id}",
    "type": "Feature",
    "properties": {
        "id": "{PROJECT_ID}",
        "createdAt": "2020-04-09T18:59:43.021173Z",
        "createdBy": "auth0|{AUTH_ID}",
        "modifiedAt": "2020-04-09T18:59:43.021173Z",
        "owner": "auth0|{AUTH_ID}",
        "status": "UNLABELED",
        "lockedBy": null,
        "lockedOn": null,
        "actions": [],
        "annotationProjectId": "{ANNOTATION_PROJECT_ID}",
        "note": null,
        "taskType": "LABEL",
        "parentTaskId": null,
        "reviews": {}
    },
    "geometry": {
        "type": "Polygon",
        "coordinates": [...]
    }
}
Projects
This is a neat one. It requests all projects that are shared with you, sorted by date created.
https://app.rasterfoundry.com/api/annotation-projects?page=0&sort=createdAt%2Cdesc&ownershipType=all&search=&pageSize=8
The JSON response includes a good bit of summary data for each of the eight paginated projects that are shown on the project list. The summary data includes the following:
- Project name and project type (e.g. “SEGMENTATION”)
- The project geometry, namely a partial GeoJSON feature (under the
aoifield) which only includes the geometry component - An imagery tile layer ID and URL (used to populate the project images in the project list)
- Details on the available label class groups for each project
- Summary counts of the project’s task status (unlabeled, labeled, flagged, etc)
A truncated response showing only one project is shown here:
{
    "count": 177,
    "hasPrevious": false,
    "hasNext": true,
    "page": 0,
    "pageSize": 8,
    "results": [
        {
            "id": "{RESULT_ID}",
            "createdAt": "2020-09-15T11:26:48.260469Z",
            "createdBy": "auth0|{AUTH_ID}",
            "name": "STAC Data Sprint - Cloud labeling | Simien Mountains",
            "projectType": "SEGMENTATION",
            "taskSizeMeters": 5274.0485,
            "taskSizePixels": 512,
            "aoi": {
                "type": "Polygon",
                "coordinates": [...]
            },
            "labelersTeamId": null,
            "validatorsTeamId": null,
            "projectId": "{PROJECT_ID}",
            "status": {
                "progressStage": "READY"
            },
            "tileLayers": [
                {
                    "id": "{LAYER_ID}",
                    "name": "Project Layer",
                    "url": "https://tiles.rasterfoundry.com/{LAYER_ID}/{z}/{x}/{y}/",
                    "default": true,
                    "overlay": false,
                    "layerType": "TMS",
                    "annotationProjectId": "{ANNOTATION_PROJECT_ID}"
                    "quality": null
                }
            ],
            "labelClassGroups": [
                {
                    "id": "{LABEL_CLASS_GROUP_ID}",
                    "name": "labels",
                    "annotationProjectId": "{ANNOTATION_PROJECT_ID}",
                    "index": 0,
                    "labelClasses": [
                        {
                            "id": "{LABEL_ID}",
                            "name": "Cloud",
                            "annotationLabelClassGroupId": "{ANNOTATION_LABEL_CLASS_GROUP_ID}",
                            "colorHexCode": "#ff00f6",
                            "default": false,
                            "determinant": false,
                            "index": 0,
                            "geometryType": null,
                            "description": null
                        },
                        {
                            "id": "{LABEL_ID}",
                            "name": "Background",
                            "annotationLabelClassGroupId": "{ANNOTATION_LABEL_CLASS_GROUP_ID}",
                            "colorHexCode": "#006401",
                            "default": false,
                            "determinant": false,
                            "index": 1,
                            "geometryType": null,
                            "description": null
                        }
                    ]
                }
            ],
            "taskStatusSummary": {
                "FLAGGED": 0,
                "LABELING_IN_PROGRESS": 2,
                "VALIDATION_IN_PROGRESS": 0,
                "INVALID": 0,
                "LABELED": 437,
                "UNLABELED": 2,
                "VALIDATED": 0
            },
            "campaignId": null,
            "capturedAt": null
        },
        ...
    ]
}
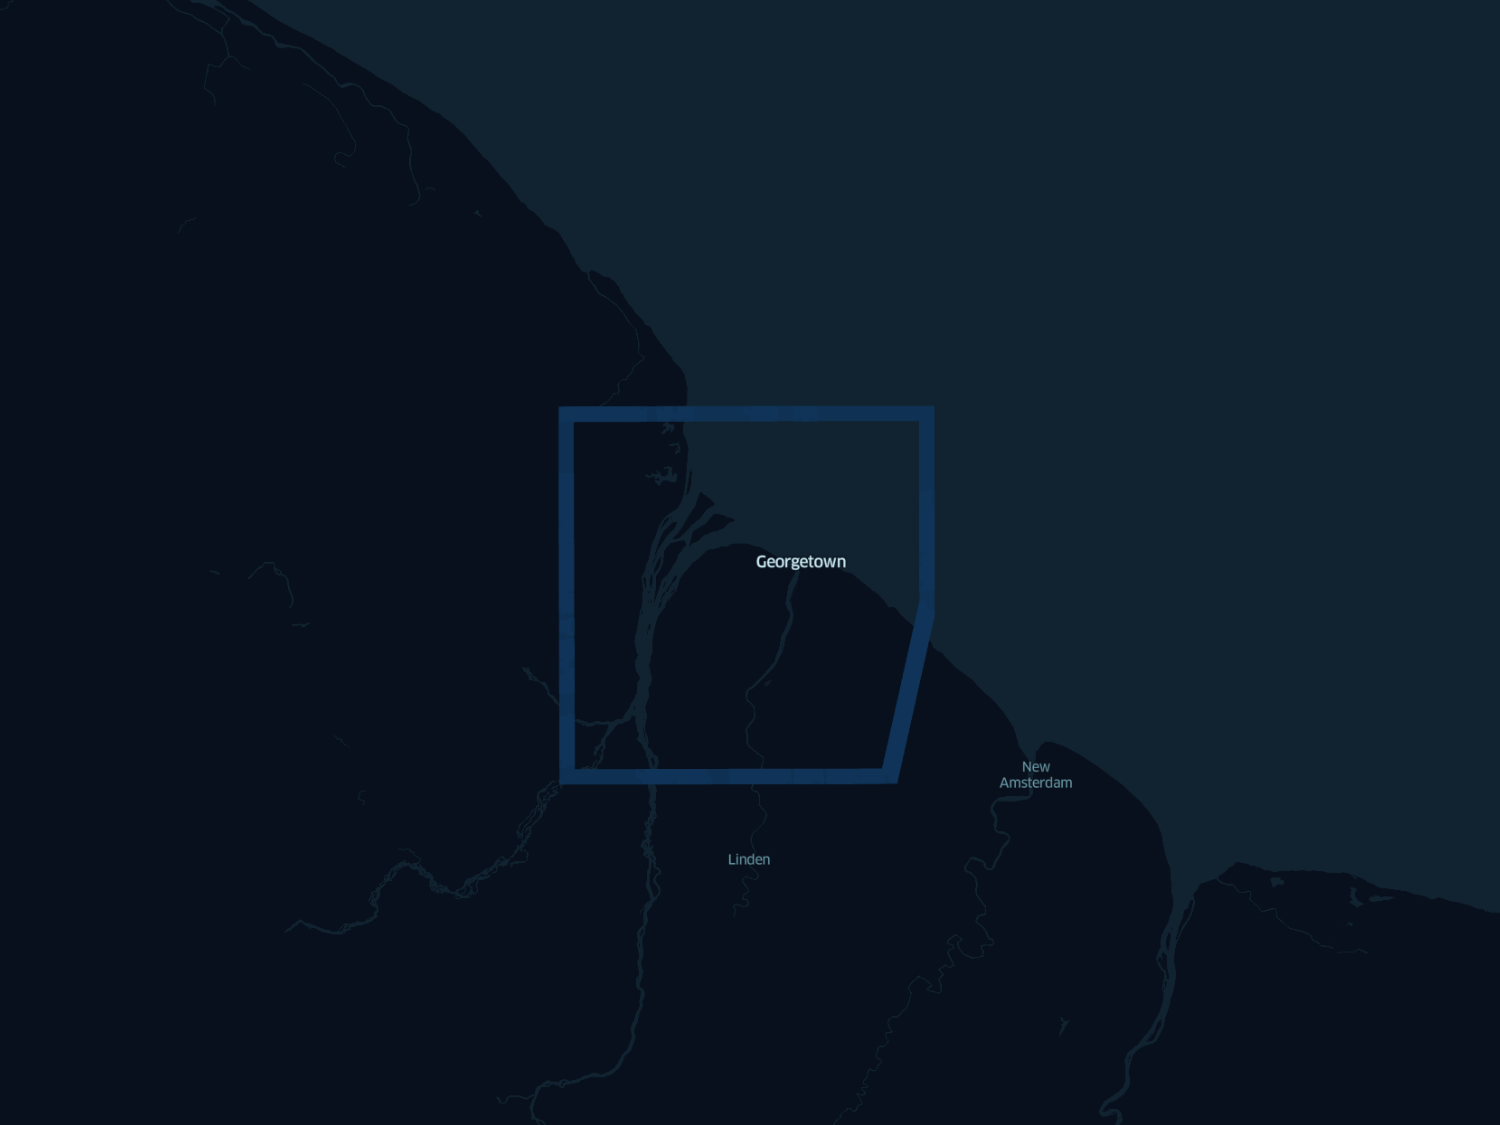
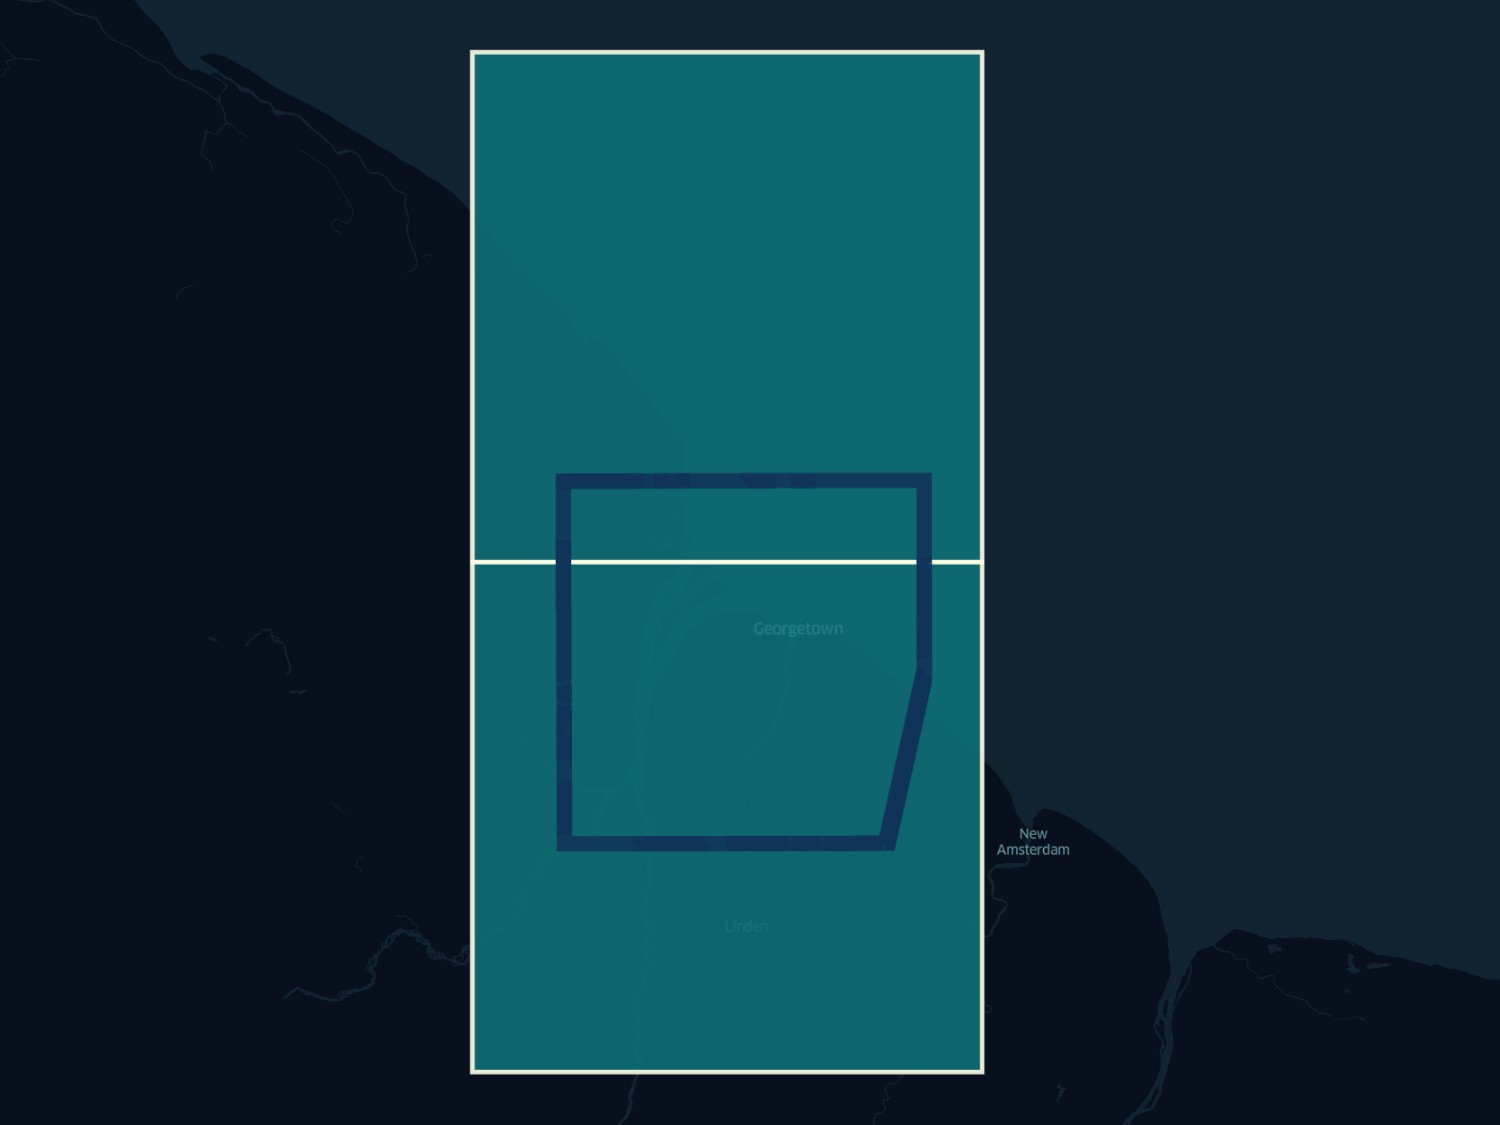
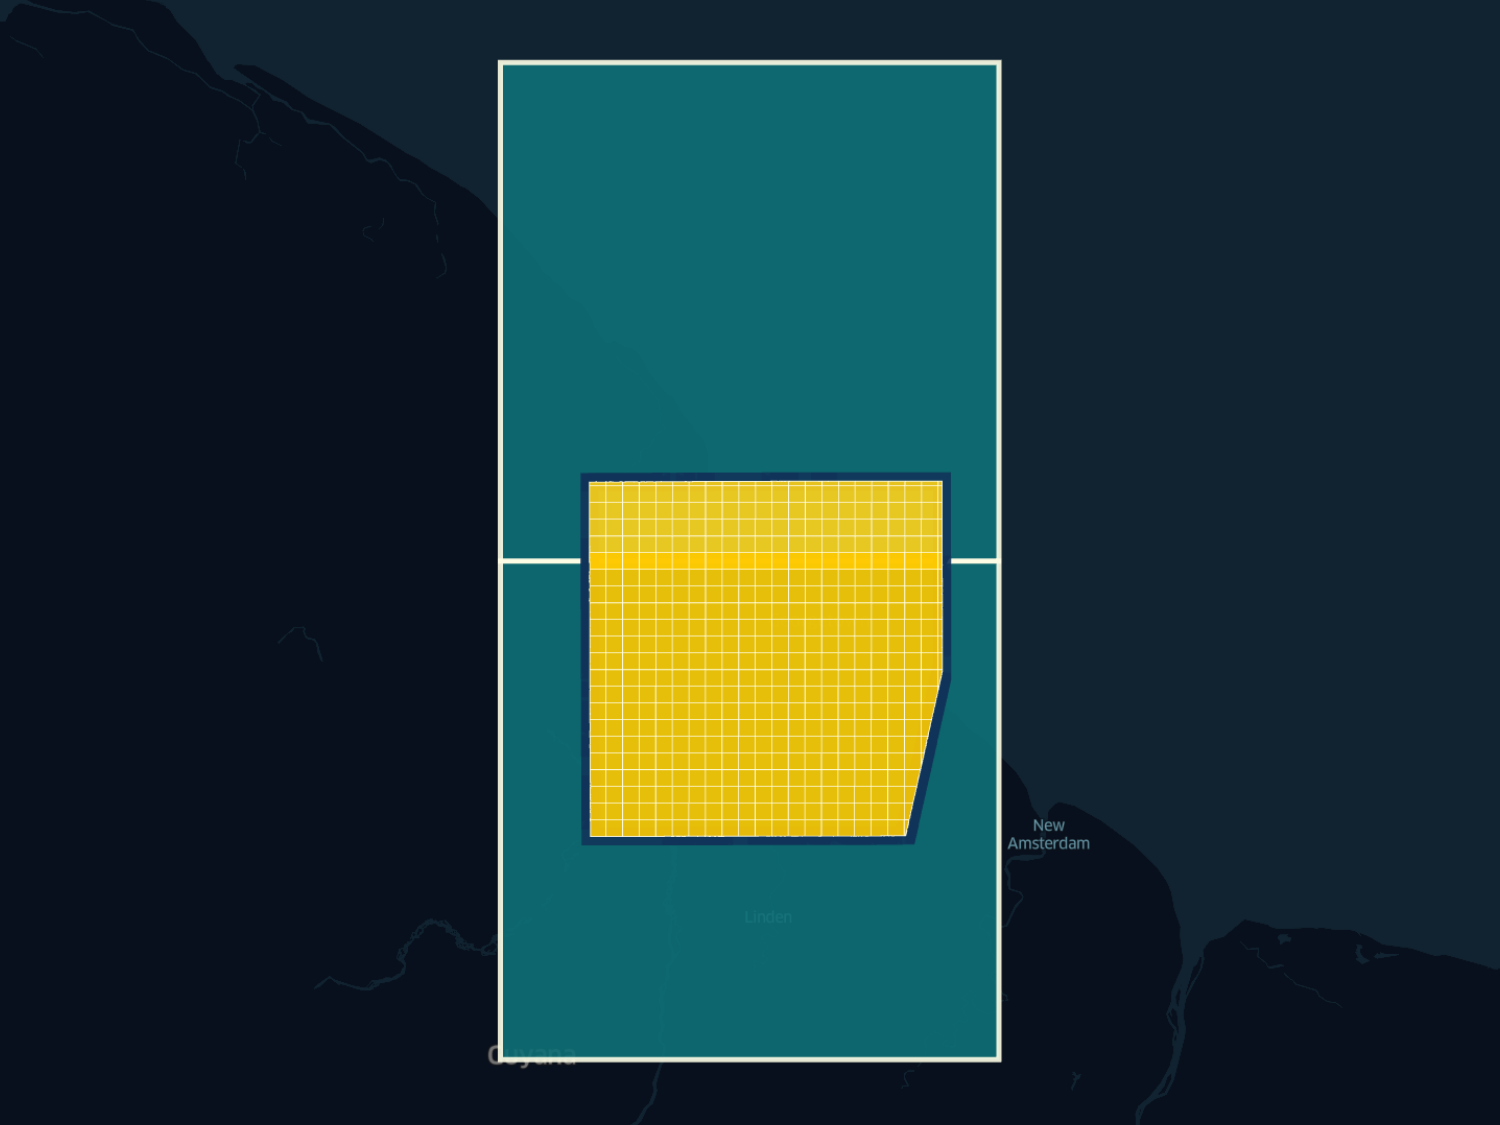
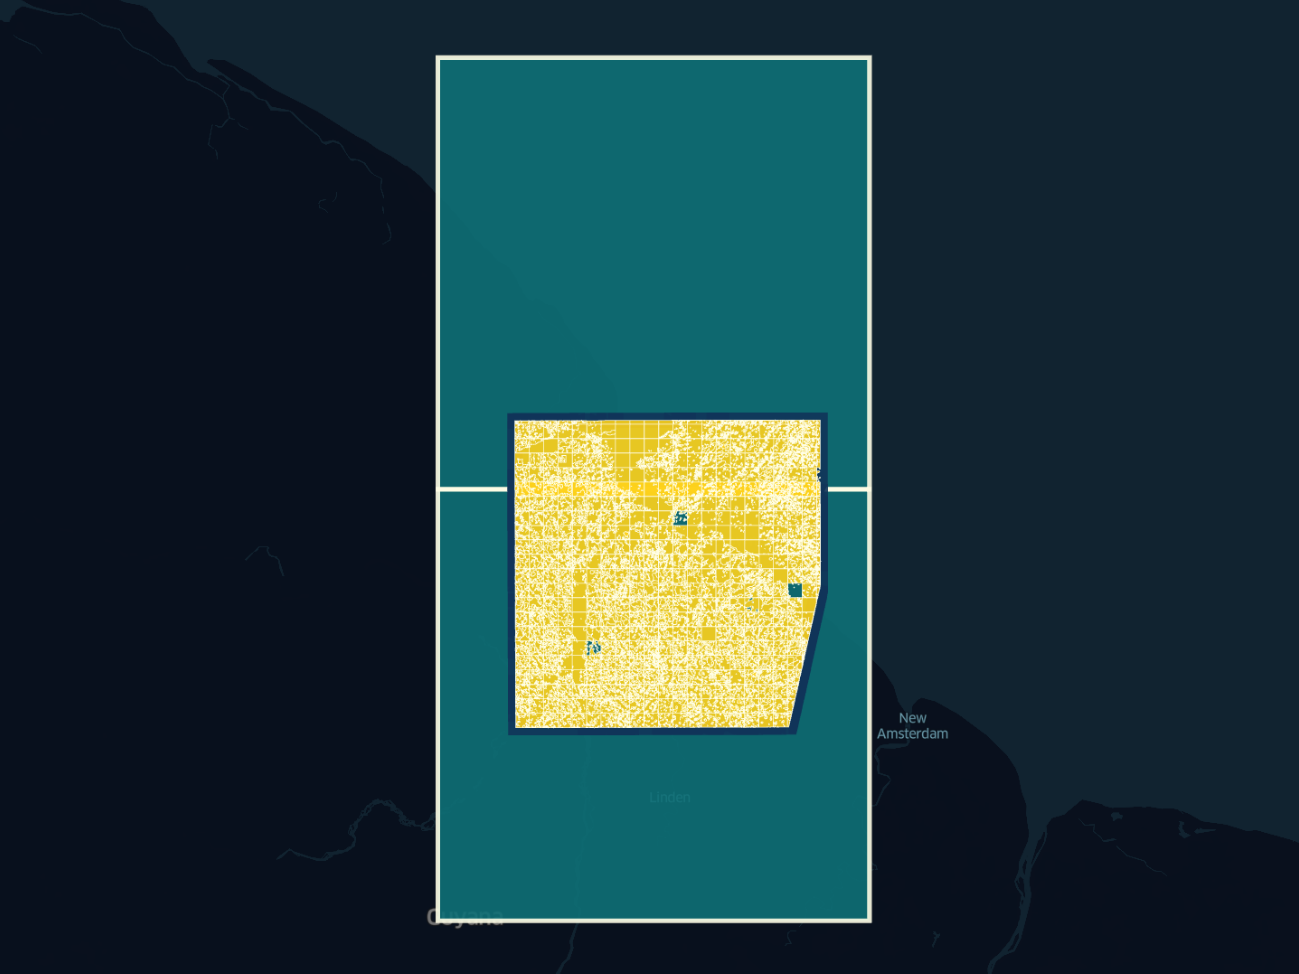
One thing I want to highlight on this page are the project images. Although they’re static, they’re actually generated by dynamic tile image requests. Tile image requests are made for a basemap layer (via CARTO) and then overlayed with actual project imagery via tiles.rasterfoundry.com, using the tileLayers.url field in the JSON response above. Presumably, the project geometry that is included in the project list data is used to generate the covering tiles needed in order to make the tile image requests (at zoom 8 in this case). An example of this project image tiling is shown below.
These tile images are most likely then combined and cropped client-side, and then set as inline data:image/png;base64 binary data for an <img> element’s src attribute. It’s unclear why the CARTO basemap is needed in this case, but it could just be either a default action and/or a fail-safe in case an imagery tile doesn’t load.
It might seem like a bit of overkill to use an imagery tile service here since the project images end up being static and aren’t in any way interactive. But it’s a really nice, modern touch that smartly relies on the robust tile service infrastructure that they’ve built up with Raster Foundry.
Project ID’s
Last on this page, a sequence of project-specific requests are made using each of the separate project ID’s that were listed in the paginated list of results from the projects response above.
https://app.rasterfoundry.com/api/annotation-projects/{PROJECT_ID}
Oddly though, the response data here is the exact same as that contained in the results object list in the projects list response above. This sequence seems extraneous so it’s not readily apparent to me why they’re needed here.
Project
After you click on one of the project cards, a project-specific page loads.
https://groundwork.azavea.com/app/projects/{PROJECT_ID}/overview
This page shows a map of the project area and all of its tasks, along with some summary information about the task statuses and classification groups.
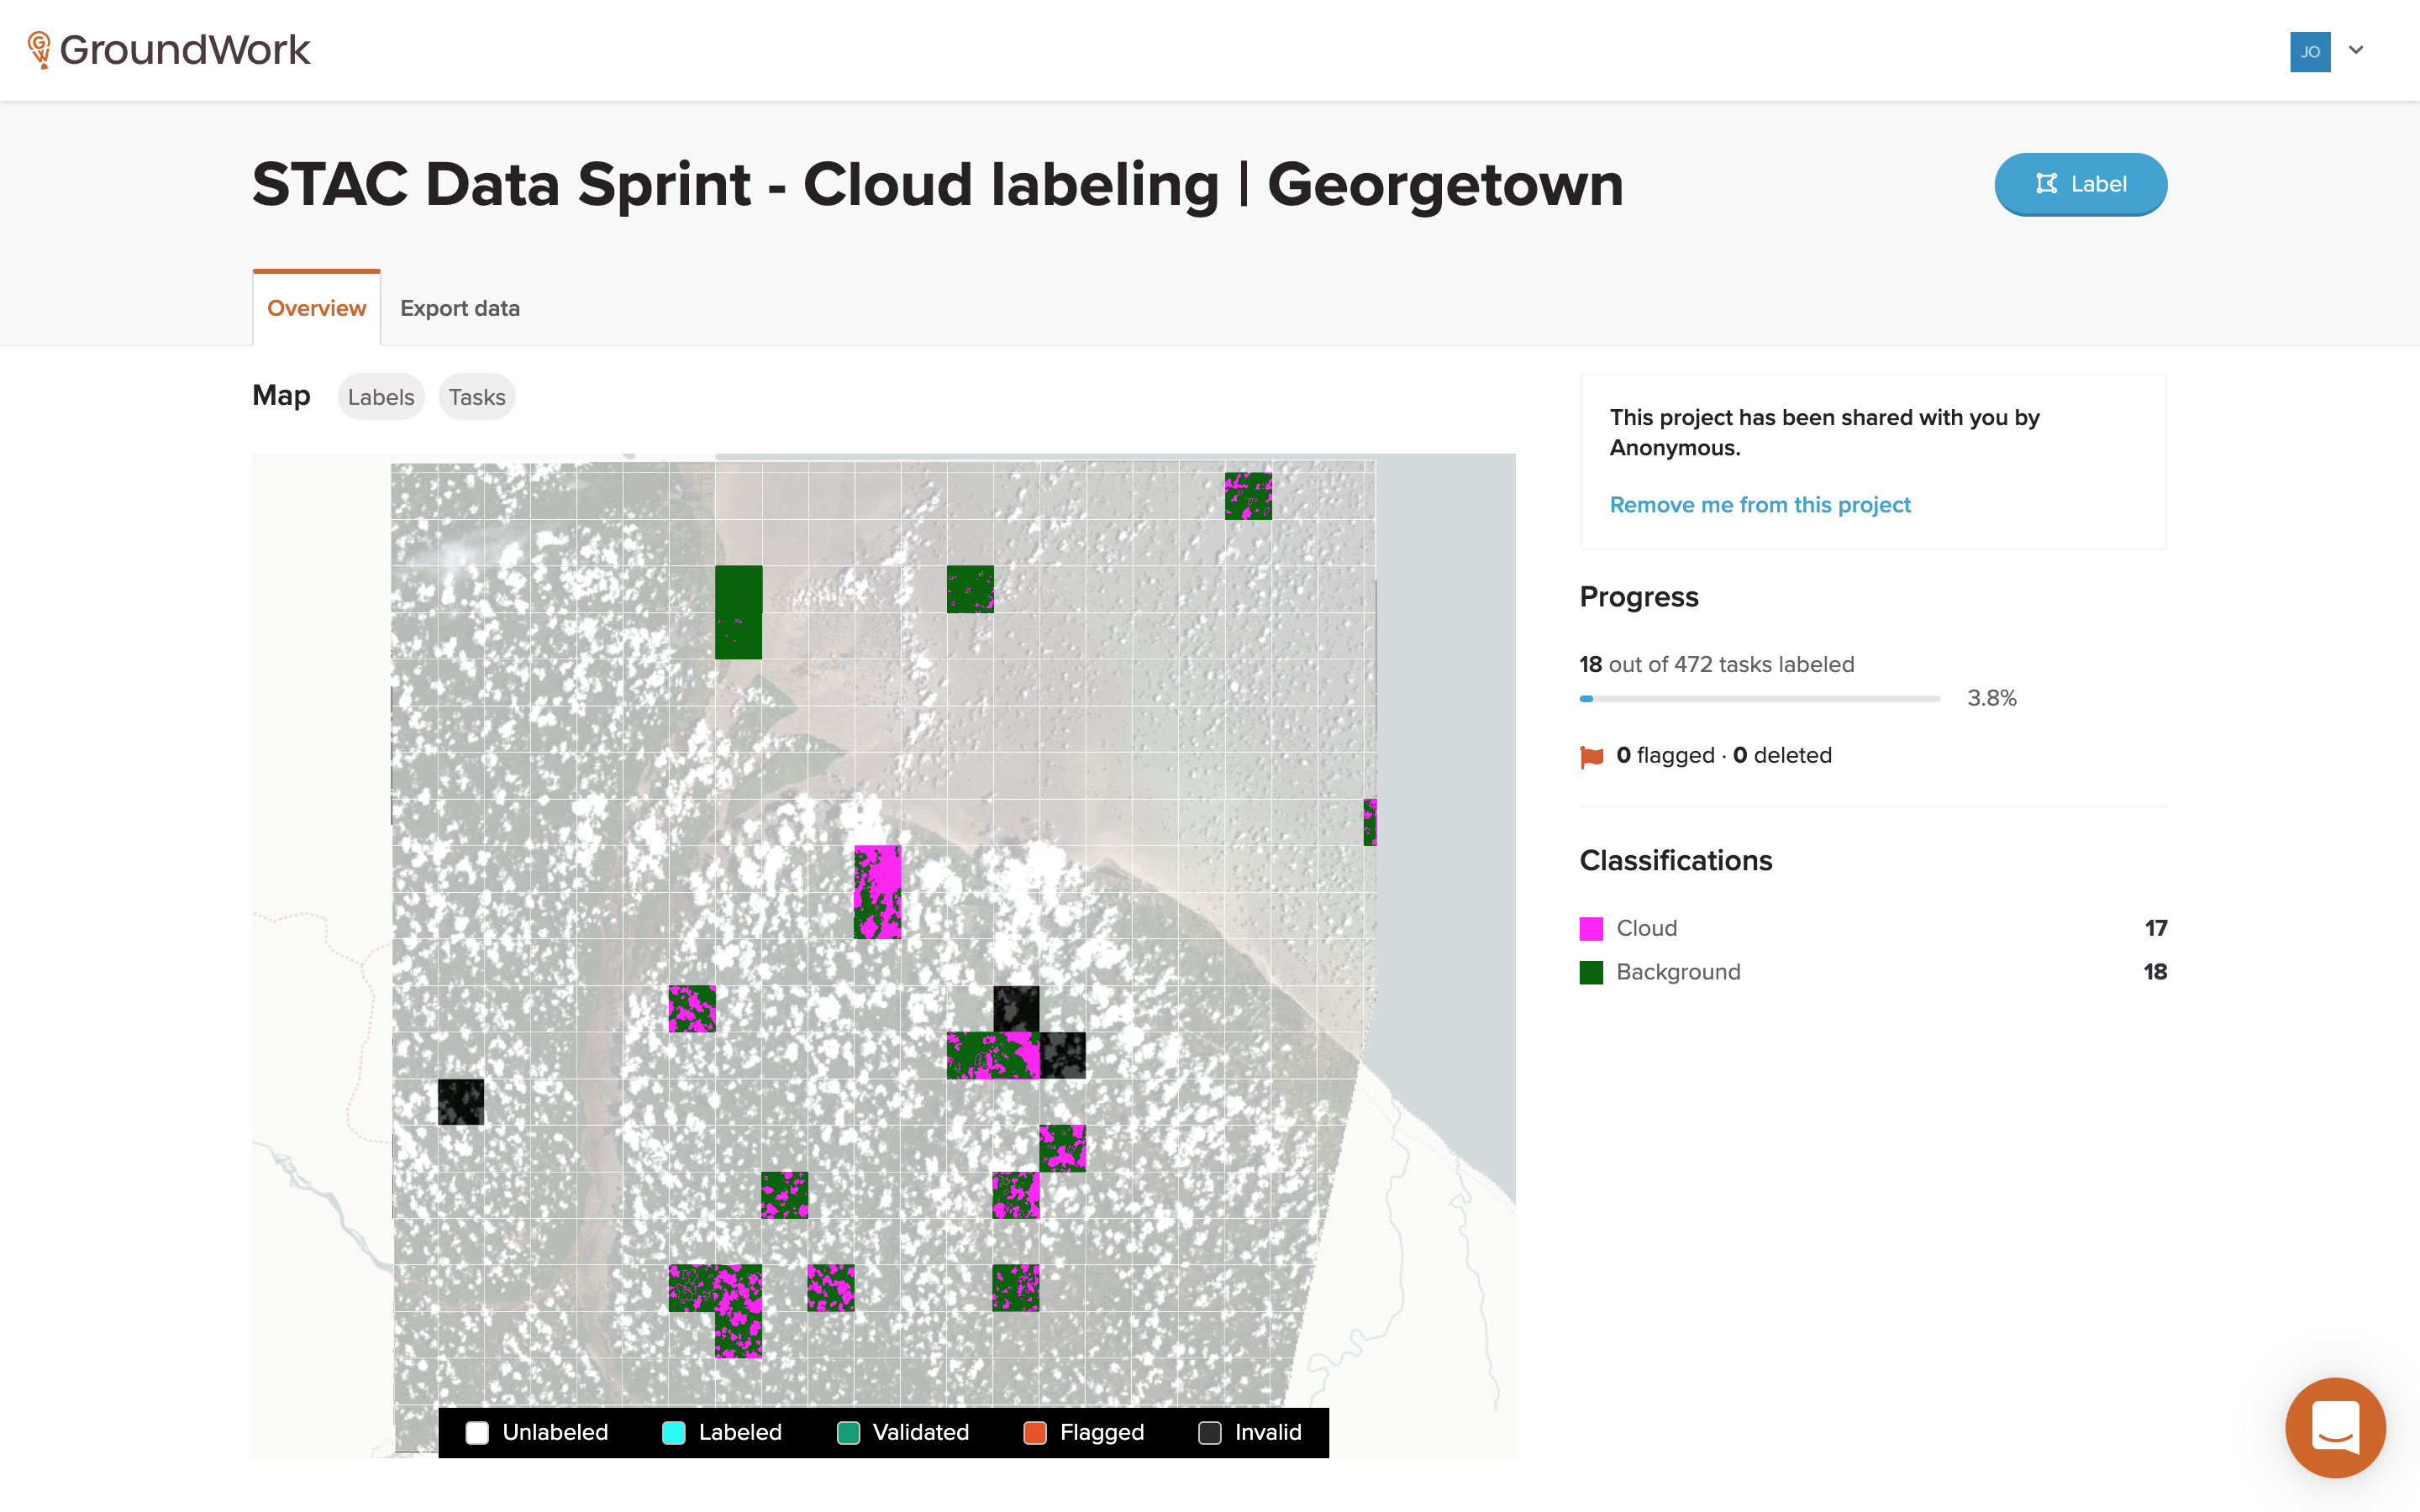 Image: GroundWork
A lot is happening here and this is where we start getting into the actual task and label data requests.
Project ID
First, a project-specific request is made using the selected project’s Project ID, same as the seemingly extraneous
requests above. The same type of project-specific response data as before is returned, which is now used to populate all of the project status fields. The response data also includes the project area’s polygon geometry in a partial GeoJSON format (specifically just the geometry field).
Similar to the project list page, this geometry is probably used to generate the needed map tiles client-side (this time at zoom 10). Requests are made again to both Carto for the basemap and Raster Foundry for the imagery, the latter again using the URL found in the project response data (field tileLayers[n].url), which looks something like this:
https://tiles.rasterfoundry.com/{LAYER_ID}/10/{x}/{y}/
These tile images are displayed on the interactive deck.gl map which also contains the tasks and existing labels.
Tasks and Labels
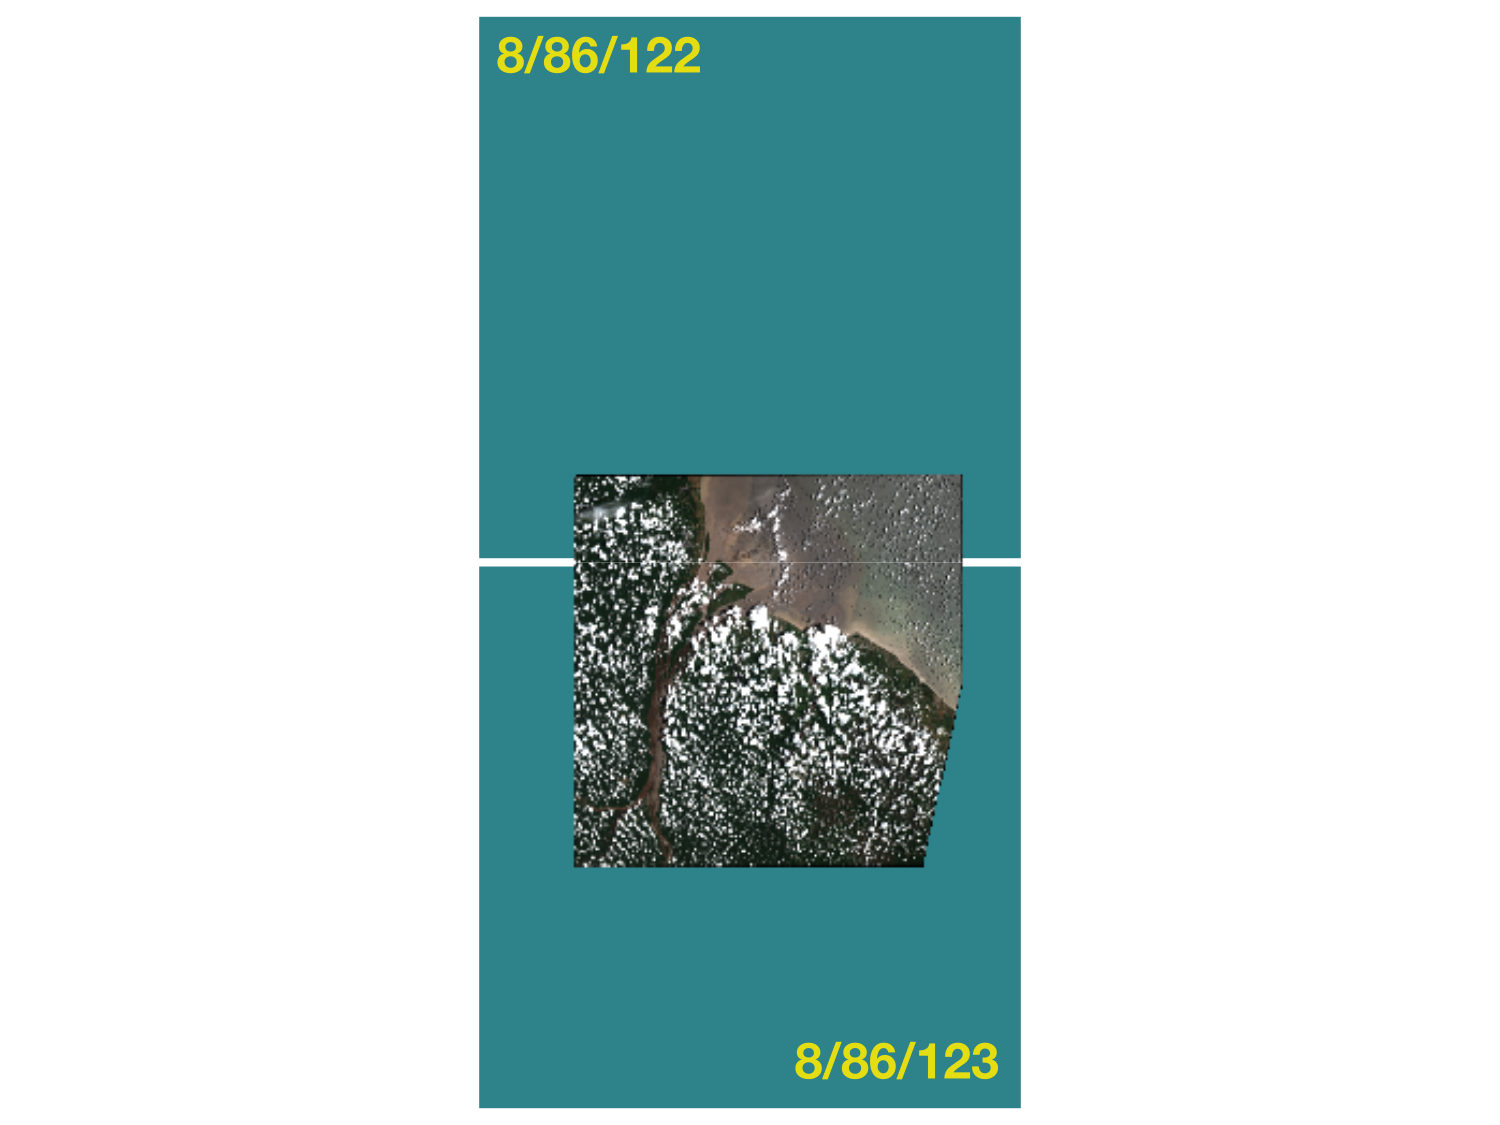
Ok, here’s where things start to get really interesting. Let’s start again looking at the project area tiled at zoom 8.
The project page makes a series of tile requests to Raster Foundry for Mapbox Vector Tiles that cover these project tiles, specifically vector data of the project’s tasks and existing labels.
https://tiles.rasterfoundry.com/mvt/{PROJECT_ID}/tasks/8/86/122?token={TOKEN}
https://tiles.rasterfoundry.com/mvt/{PROJECT_ID}/labels/8/86/122?token={TOKEN}
Note that task and label data are project specific, so these requests use a PROJECT_ID, as compared to the use of a LAYER_ID like in the imagery tile requests.
Downloading some of these Mapbox Vector Tiles locally, we can then convert them to GeoJSON using tippecanoe via the following command:
tippecanoe-decode -c tasks.mbtiles {z} {x} {y}
This is done to better view the task data in the binary vector layer file, as shown here:
{
    "type": "FeatureCollection",
    "properties": {
        "layer": "default",
        "version": 2,
        "extent": 4096
    },
    "features": [
        {
            "type": "Feature",
            "properties": {
                "id": "{TASK_ID}",
                "created_at": "2020-09-13 12:45:10.905947",
                "created_by": "auth0|{AUTH_ID}",
                "modified_at": "2020-09-13 12:45:10.905947",
                "owner": "auth0|{AUTH_ID}",
                "status": "LABELED",
                "geometry": "0103000020110F00000100000005000000E8AA9AB8F4DF58C180A0408597492841E8AA9AB8F4DF58C16BDFB9B197722841C299DB69DDDA58C16BDFB9B197722841C299DB69DDDA58C180A0408597492841E8AA9AB8F4DF58C180A0408597492841",
                "annotation_project_id": "{ANNOTATION_PROJECT_ID}",
                "task_type": "LABEL"
            },
            "geometry": {
                "type": "Polygon",
                "coordinates": [...]
            }
        },
        ...
    ]
}
The task data layer consists of a collection of square polygons, each one corresponding to a specific task for the project. Each task also contains metadata for the task’s ID, status and what appears to be a WKB hex string of the task polygon geometry. It’s just a guess, but it looks like the WKB hex string defines a polygon geometry as lat/lng offsets in meters, maybe something to do with a deck.gl coordinates system definition.
This task vector data layer appears to be used in drawing the tasks on the interactive project map, which then allows a user to click on a task to take you to the task page. Because it’s a vector layer, a mouse click on the map can be detected and the click location can then be associated with a specific task, the metadata of which then drives the page load for the selected task. I really like how the information needed to drive these interactions is embedded in the map’s vector layer, a subtle but well-designed feature that you don’t even realize is happening as you interact with the embedded map.
Plotting the combined GeoJSON Features from the task vector tiles looks like what we’d expect and similar to what is shown on the project page (if no labels are overlayed).
In a similar way, the label vector layer contains all of the existing labels (in this case, Cloud and Background) as multi-polygons, which are similarly shown in the project map. The vector layer (converted via tippecanoe and shown below in GeoJSON) contains both the geometry as well as the label class name and color to be displayed for each label class.
{
    "type": "FeatureCollection",
    "properties": {
        "layer": "default",
        "version": 2,
        "extent": 4096
    },
    "features": [
        {
            "type": "Feature",
            "properties": {
                "name": "Background",
                "color_hex_code": "#006401"
            },
            "geometry": {
                "type": "MultiPolygon",
                "coordinates": [...]
            }
        },
        {
            "type": "Feature",
            "properties": {
                "name": "Cloud",
                "color_hex_code": "#ff00f6"
            },
            "geometry": {
                "type": "MultiPolygon",
                "coordinates": [...]
            }
        },
        ...
    ]
}
Converting and combining these label vector tiles into GeoJSON lets us plot this data as well, which again looks like what we’d expect based on what’s displayed on the project map.
Export Data
Another nice feature on the Project page is the ability to export a STAC catalog of the project data, including the existing labels for each task.
An export is initiated by clicking a button which triggers a POST request to the following URL:
https://app.rasterfoundry.com/api/stac
which includes the JSON body:
{
    "name": "STAC Data Sprint - Cloud labeling | Georgetown-1600277888431",
    "owner": "auth0|{AUTH_ID}",
    "license": {
        "license": "proprietary",
        "url": null
    },
    "taskStatuses": [],
    "annotationProjectId": "{ANNOTATION_PROJECT_ID}"
}
This POST request seems to initiate a back-end process that generates the STAC collection, which takes a handful of minutes. A follow-up GET request, likely triggered by a callback from the POST request, provides a JSON response that contains metadata for all exports that have been requested, including those completed and/or still processing. This metadata includes the URL’s for the S3 locations where the generated STAC exports are stored.
{
    "count": 2,
    "hasPrevious": false,
    "hasNext": false,
    "page": 0,
    "pageSize": 999,
    "results": [
        {
            "id": "{EXPORT_ID}",
            "createdAt": "2020-09-17T01:23:35.438Z",
            "createdBy": "auth0|{AUTH_ID}",
            "modifiedAt": "2020-09-17T01:23:35.438Z",
            "owner": "auth0|{AUTH_ID}",
            "name": "STAC Data Sprint - Cloud labeling | Georgetown-1600305814996",
            "license": {
                "license": "proprietary",
                "url": null
            },
            "exportLocation": null,
            "exportStatus": "NOTEXPORTED",
            "taskStatuses": [],
            "downloadUrl": null,
            "annotationProjectId": "{ANNOTATION_PROJECT_ID}"
        },
        {
            "id": "{EXPORT_ID}",
            "createdAt": "2020-09-16T17:38:08.592Z",
            "createdBy": "auth0|{AUTH_ID}",
            "modifiedAt": "2020-09-16T17:43:16Z",
            "owner": "auth0|{AUTH_ID}",
            "name": "STAC Data Sprint - Cloud labeling | Georgetown-1600277888431",
            "license": {
                "license": "proprietary",
                "url": null
            },
            "exportLocation": "s3://rasterfoundry-production-data-us-east-1/stac-exports/{EXPORT_ID}",
            "exportStatus": "EXPORTED",
            "taskStatuses": [],
            "downloadUrl": "https://rasterfoundry-production-data-us-east-1.s3.amazonaws.com/stac-exports/{EXPORT_ID}/catalog.zip?{QUERY_PARAMETERS}",
            "annotationProjectId": "{ANNOTATION_PROJECT_ID}"
        }
    ]
}
Task
Clicking on a specific task tile in the project page map redirects you to a task page at the following URL:
https://groundwork.azavea.com/app/projects/{PROJECT_ID}/tasks/{TASK_ID}/label/segmentation
Similar as before, Carto basemap tiles are loaded and then overlayed with the Raster Foundry imagery tiles from that project. The example image below shows what this task page looks like with no existing labels.
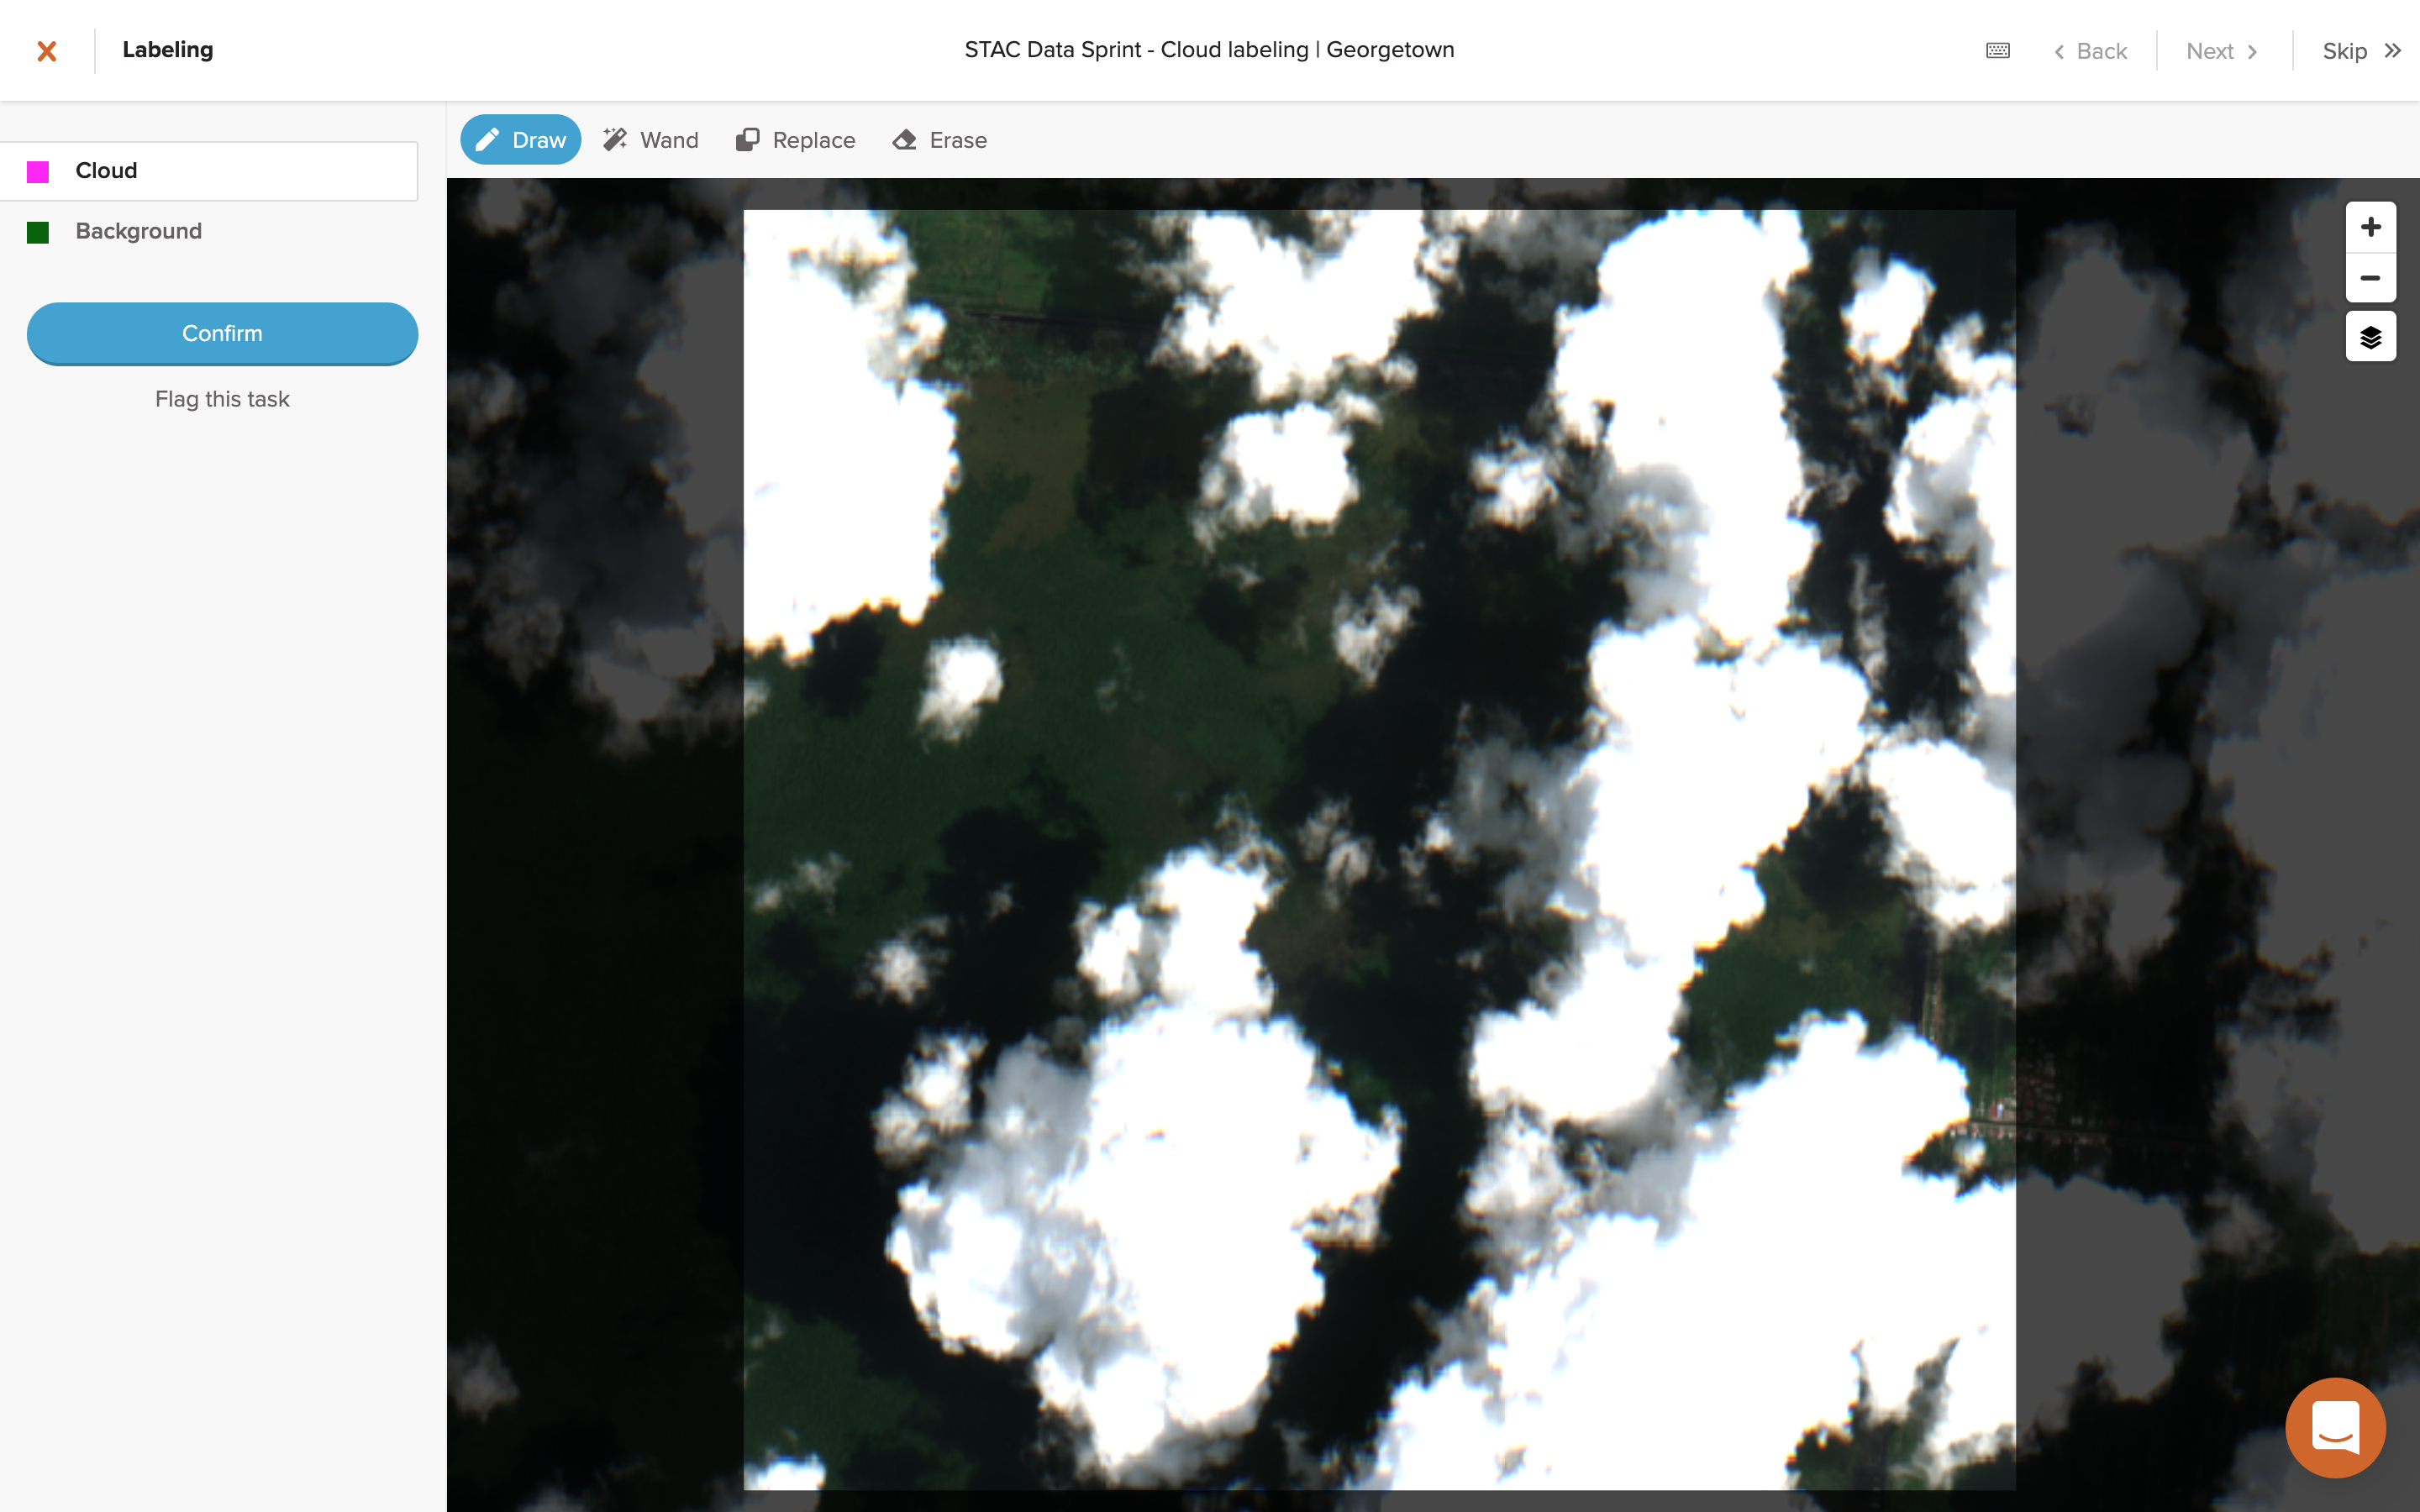 Image: GroundWork
Next, a request is made to the same Project ID endpoint as before, likely just to set some of the button actions on this task page (next task, previous task, etc).
Task ID
A request is then made for the metadata of this specific Task ID:
https://app.rasterfoundry.com/api/annotation-projects/{PROJECT_ID}/tasks/{TASK_ID}
The response is a GeoJSON Feature of the task which provides its geometry and also includes a history of actions that have been taken on the task, notably transitions between task statuses (e.g. UNLABELED, LABELING_IN_PROGRESS, LABELED, etc).
{
    "id": "{TASK_ID}",
    "type": "Feature",
    "properties": {
        "id": "{TASK_ID}",
        "createdAt": "2020-09-13T12:45:10.905947Z",
        "createdBy": "auth0|{AUTH_ID}",
        "modifiedAt": "2020-09-13T12:45:10.905947Z",
        "owner": "auth0|{AUTH_ID}",
        "status": "LABELED",
        "lockedBy": null,
        "lockedOn": null,
        "actions": [
            {
                "taskId": "{TASK_ID}",
                "userId": "auth0|{AUTH_ID}",
                "timestamp": "2020-09-14T03:04:22.599928Z",
                "fromStatus": "LABELING_IN_PROGRESS",
                "toStatus": "LABELED",
                "note": null
            },
            {
                "taskId": "{TASK_ID}",
                "userId": "auth0|{AUTH_ID}",
                "timestamp": "2020-09-14T02:19:31.525333Z",
                "fromStatus": "UNLABELED",
                "toStatus": "LABELING_IN_PROGRESS",
                "note": null
            },
            {
                "taskId": "{TASK_ID}",
                "userId": "auth0|{AUTH_ID}",
                "timestamp": "2020-09-14T02:19:14.501377Z",
                "fromStatus": "LABELING_IN_PROGRESS",
                "toStatus": "UNLABELED",
                "note": null
            },
            {
                "taskId": "{TASK_ID}",
                "userId": "auth0|{AUTH_ID}",
                "timestamp": "2020-09-14T02:18:55.194879Z",
                "fromStatus": "UNLABELED",
                "toStatus": "LABELING_IN_PROGRESS",
                "note": null
            }
        ],
        "annotationProjectId": "{ANNOTATION_PROJECT_ID}",
        "note": null,
        "taskType": "LABEL",
        "parentTaskId": null,
        "reviews": {}
    },
    "geometry": {
        "type": "Polygon",
        "coordinates": [...]
    }
}
It’s not entirely clear why this response includes detailed action history data since it’s not displayed anywhere on the page as far as I can tell. It might be used to change the “lock” display if the task has already been labeled by a different user, but that also might be handled by a repeated series of lock requests that I won’t get into here.
Bounding Box
Next, a request is made to the tasks endpoint, now using a bbox query parameter. This is presumably a padded bounding box around the task’s square polygon area.
https://app.rasterfoundry.com/api/annotation-projects/{PROJECT_ID}/tasks?bbox=[...]
The response of this request is a GeoJSON FeatureCollection that contains a list of both the original task plus all eight adjacent tasks, each containing the same type of metadata properties as shown in the task GeoJSON Feature above. The purpose of this request is to gather the geometries and metadata for all adjacent tasks, data which are needed in order to get the label data for each of these tasks.
Labels
Finally, a series of requests is made for label data from both the selected task as well as each of the adjacent tasks listed in the bounding box response.
https://app.rasterfoundry.com/api/annotation-projects/{PROJECT_ID}/tasks/{TASK_ID}/labels
The response of each of these requests is a JSON array of GeoJSON Features (note, not a FeatureCollection) which contains a potentially large MultiPolygon for each of the label classes (in this class, Cloud and Background).
[
    {
        "id": "{LABEL_ID}",
        "geometry": {
            "type": "MultiPolygon",
            "coordinates": [...]
        },
        "properties": {
            "createdAt": "2020-09-14T03:04:19.948Z",
            "createdBy": "auth0|{AUTH_ID}",
            "annotationProjectId": "{PROJECT_ID}",
            "annotationTaskId": "{TASK_ID}",
            "annotationLabelClasses": ["{LABEL_CLASS_ID}"],
            "description": null
        },
        "type": "Feature"
    },
    ...
]
Unlike in the project page where the tasks and labels were drawn on the map using Mapbox Vector Tiles, here it looks like the GeoJSON MultiPolygon’s from these requests is being used to draw and stylize the labels (if any) for each of the visible tasks.
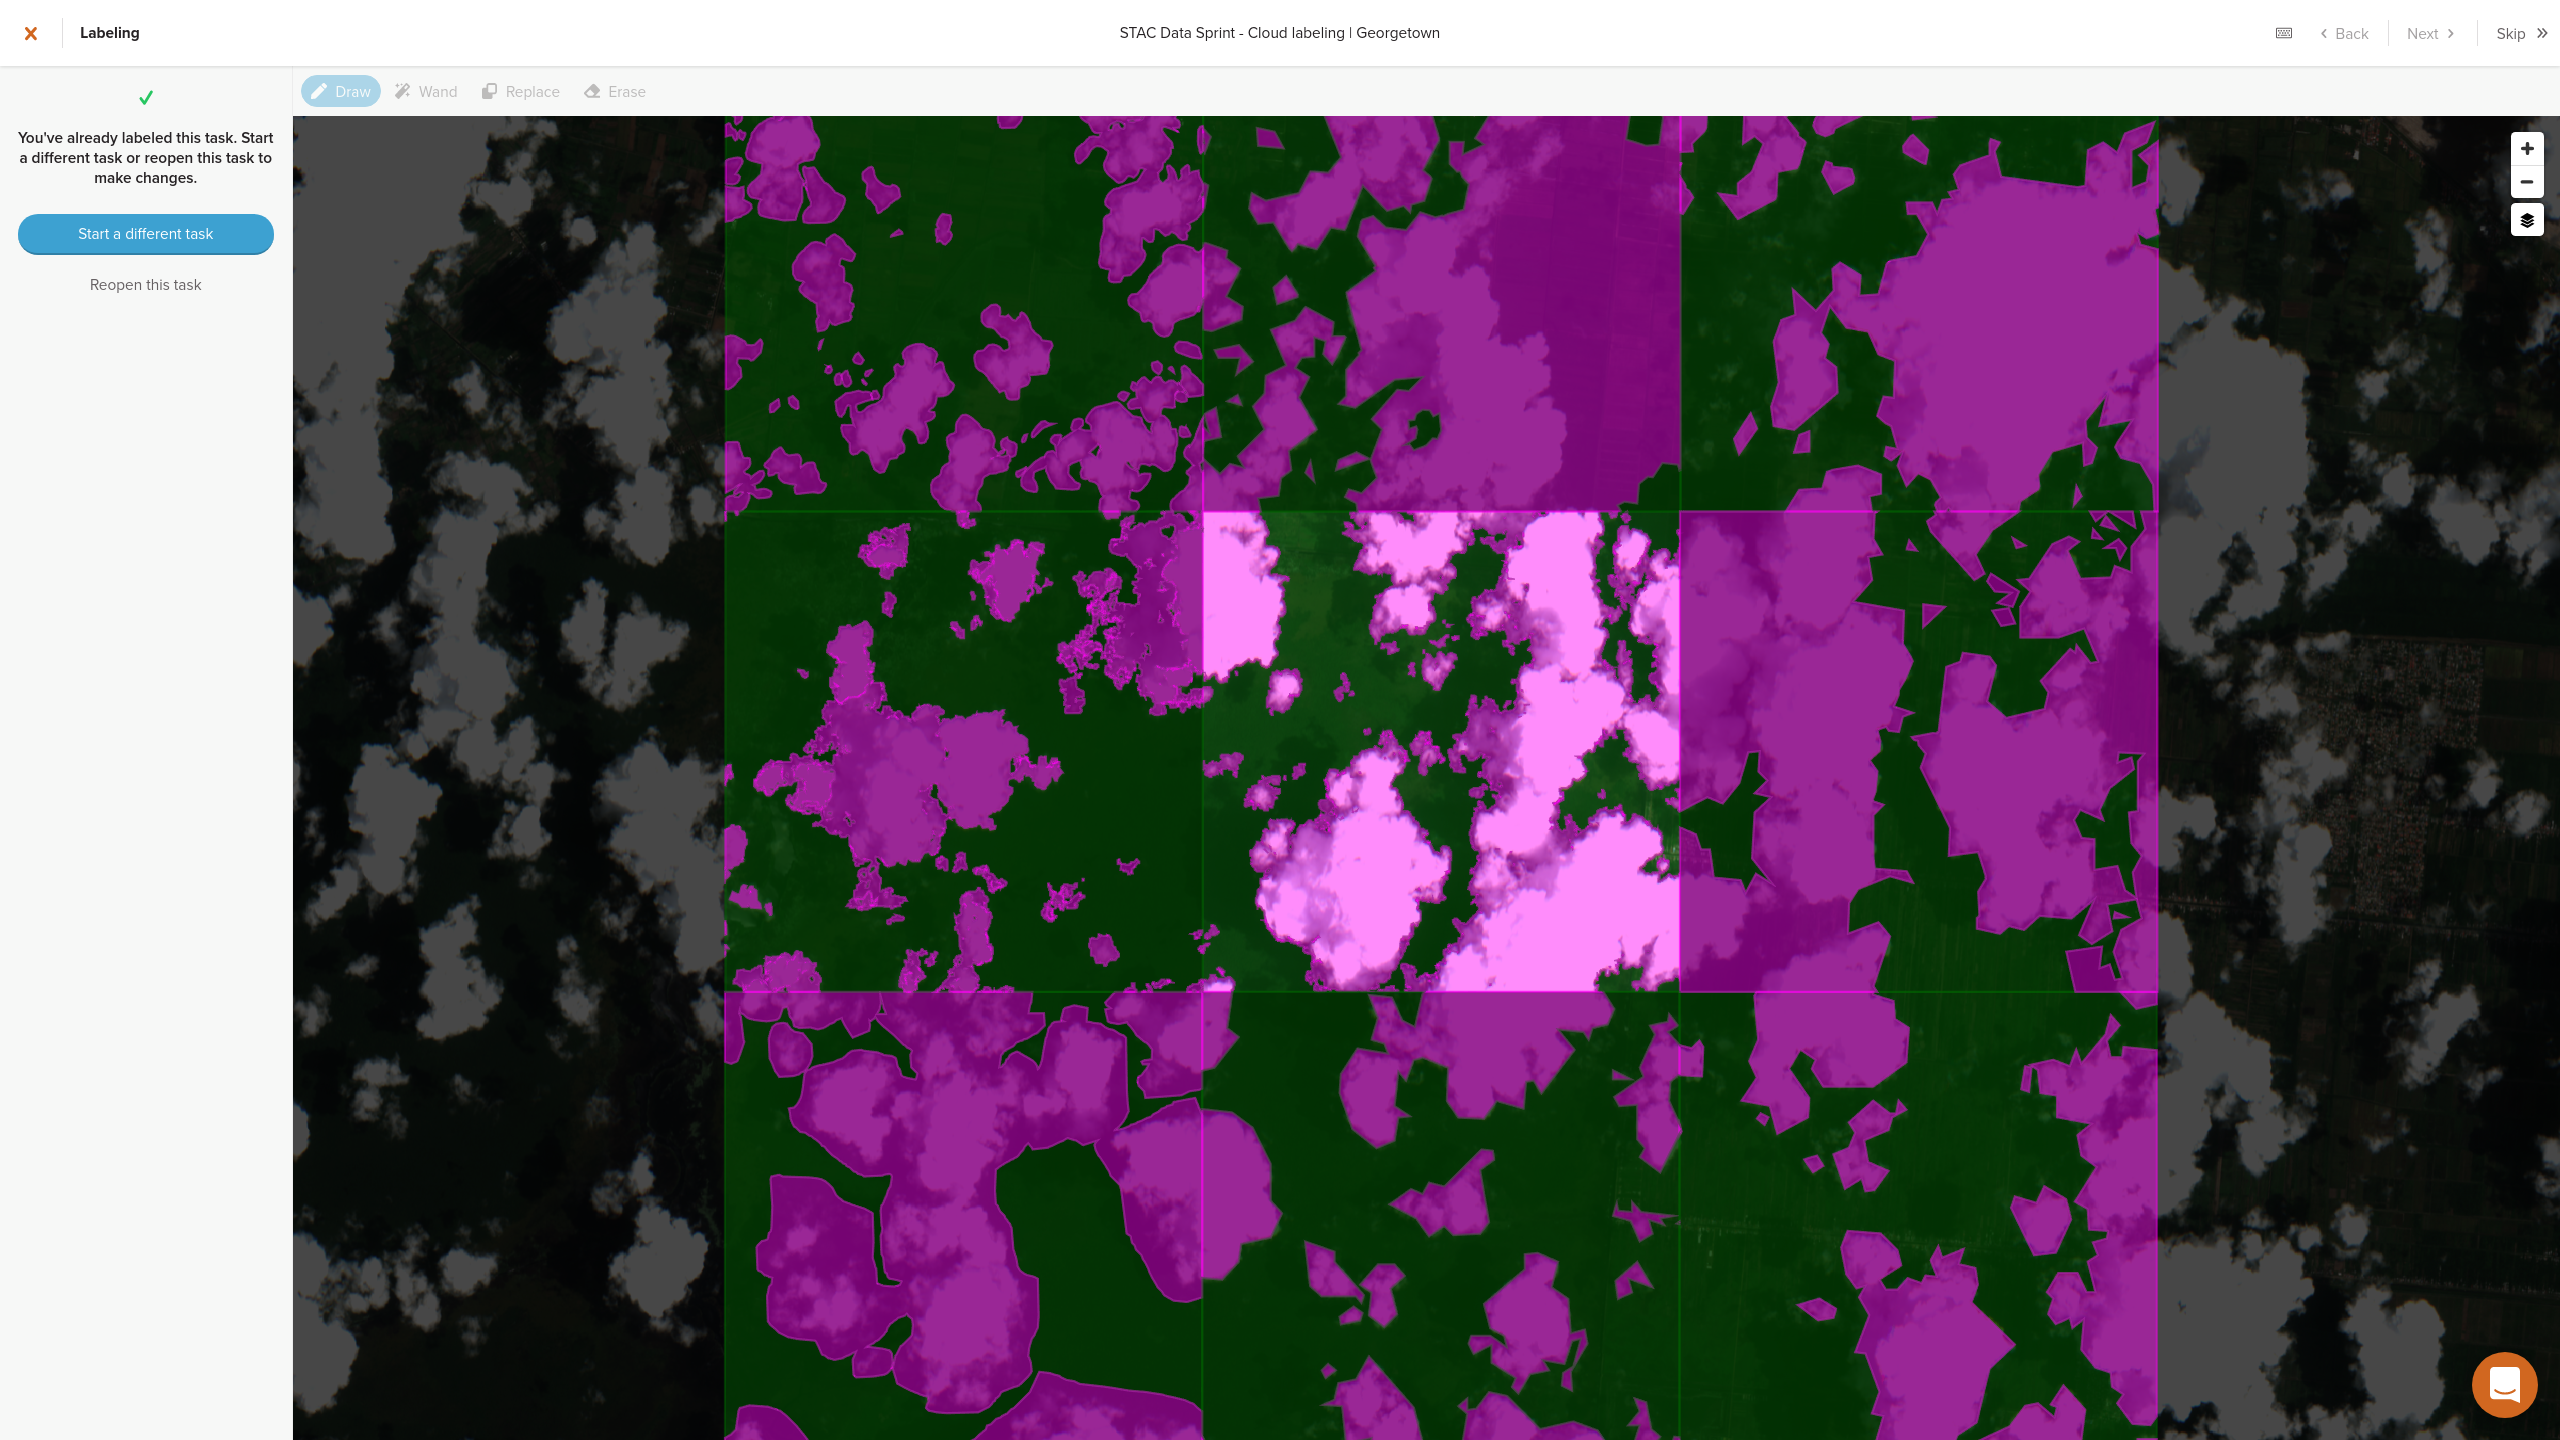 Image: GroundWork
If the selected task has not yet been labeled, then the user has the opportunity to draw labels as needed using the imagery layer. For more detail on the drawing process, see my overview of the wand feature in Part One.
No network requests are made during the labeling process, using either the Draw or Wand feature, as it’s handled completely client-side. Only once labeling is complete and the user clicks the “Confirm” button is a POST request triggered.
https://app.rasterfoundry.com/api/annotation-projects/{PROJECT_ID}/tasks/{TASK_ID}/labels
The body of this POST request contains all of the labeled geometry for the task in the form of a GeoJSON FeatureColleciton that contains MultiPolygons for each of the Label ID’s, similar to the response data shown above.
{
    "type": "FeatureCollection",
    "features": [
        {
            "type": "Feature",
            "properties": {
                "annotationLabelClasses": ["{LABEL_CLASS_ID}"]
            },
            "geometry": {
                "type": "MultiPolygon",
                "coordinates": [...]
            },
            "id": "{LABEL_ID}"
        },
        {
            "type": "Feature",
            "properties": {
                "annotationLabelClasses": ["{LABEL_CLASS_ID"]
            },
            "geometry": {
                "type": "MultiPolygon",
                "coordinates": [...]
            },
            "id": "{LABEL_ID}"
        }
    ]
}
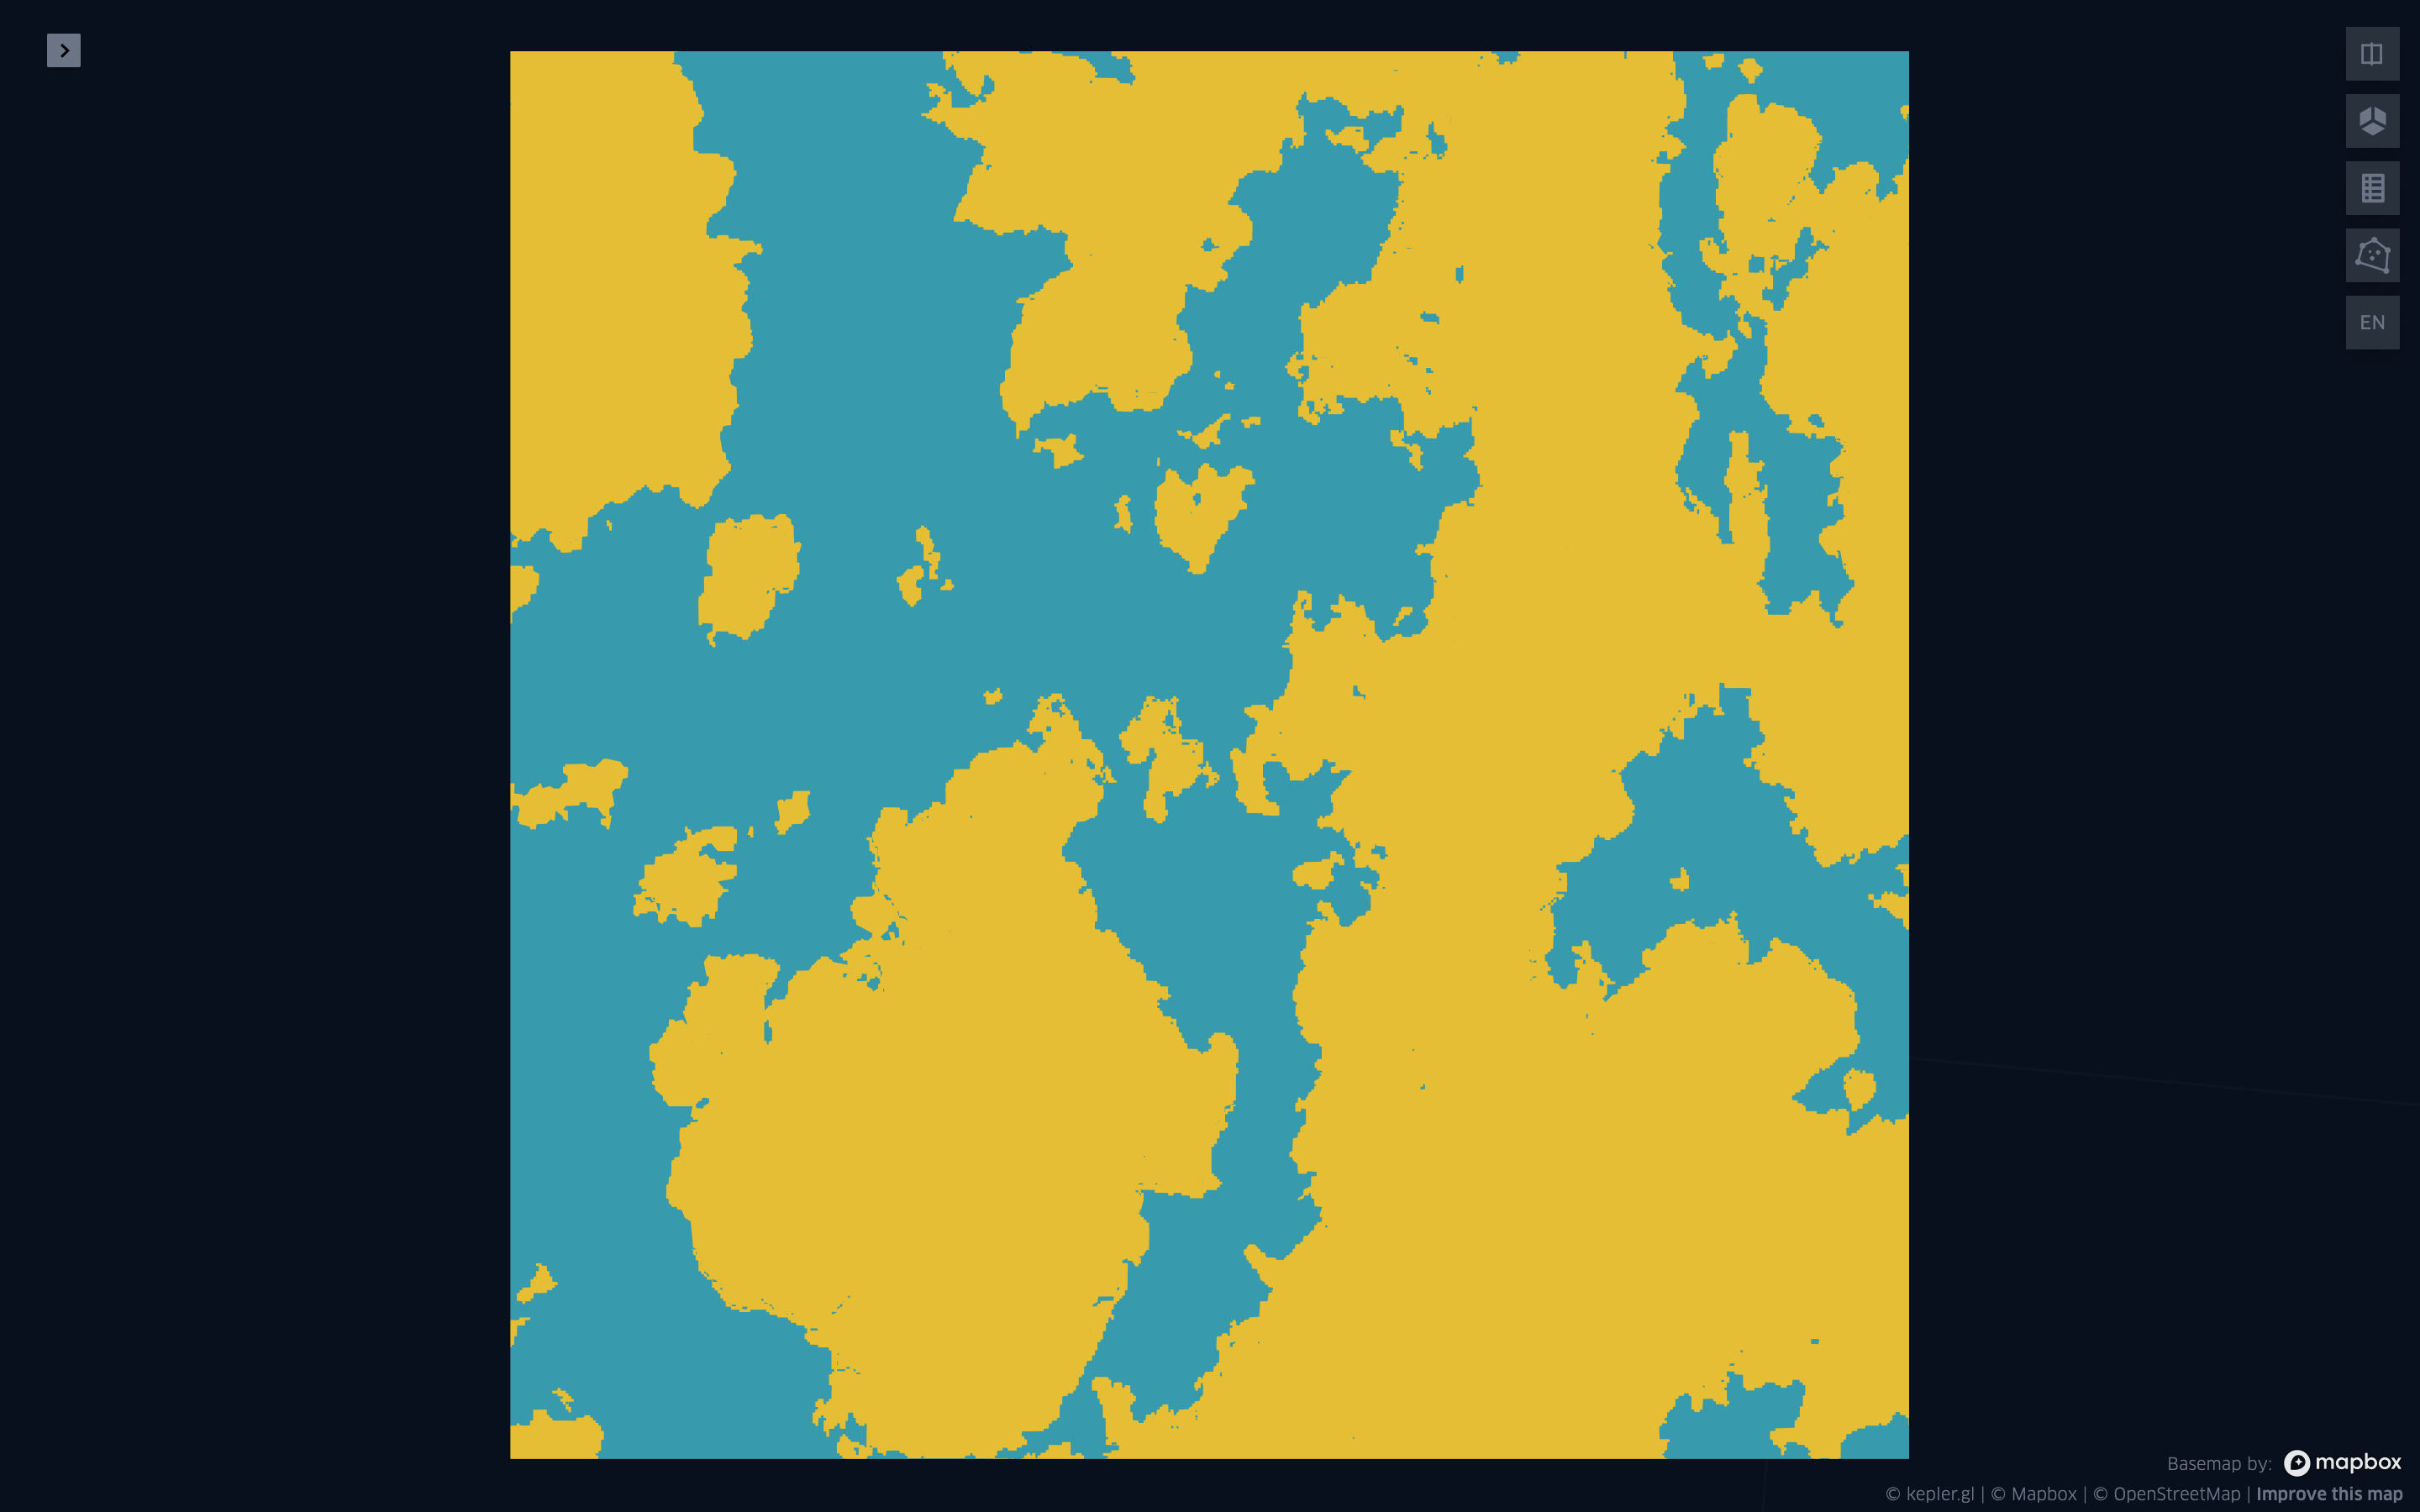
We can plot and stylize the GeoJSON for these label geometries that are submitted via the POST body, although they will look rather familiar at this point.
Final Thoughts
GroundWork is a rather impressive tool that I hope to get a chance to use more of in the future. Building it on top of the existing Raster Foundry API framework makes a lot of sense and having poked around at its inner workings here, I’m impressed at the way the Azavea team has leveraged its capabilities to build such a seamless experience in GroundWork. It speaks to the architecture of both Raster Foundry and GroundWork that they were able to integrate the two applications so well, and will definitely serve as inspiration for my own future geospatial data architecting.
I may continue this series on GroundWork at some point. I’d still like to look at the client-side Javascript in a bit more detail, both to confirm some of my suspicions noted here at how data requests are being used in the UI and also to better understand how they’ve integrated the magic-wand-js library as I briefly noted in Part One, among other things. I may also try to pull out some metrics from my submitted tasks during the data labelling competition as a potentially interesting case study.
Hopefully more to follow!
- Posted on:
- September 18, 2020
- Length:
- 16 minute read, 3216 words
- See Also: