GOES-16 Images & Animations
By Jon Engelsman in Tutorials
March 26, 2018
My first attempt at making Earth animations using GOES-16 satellite imagery.
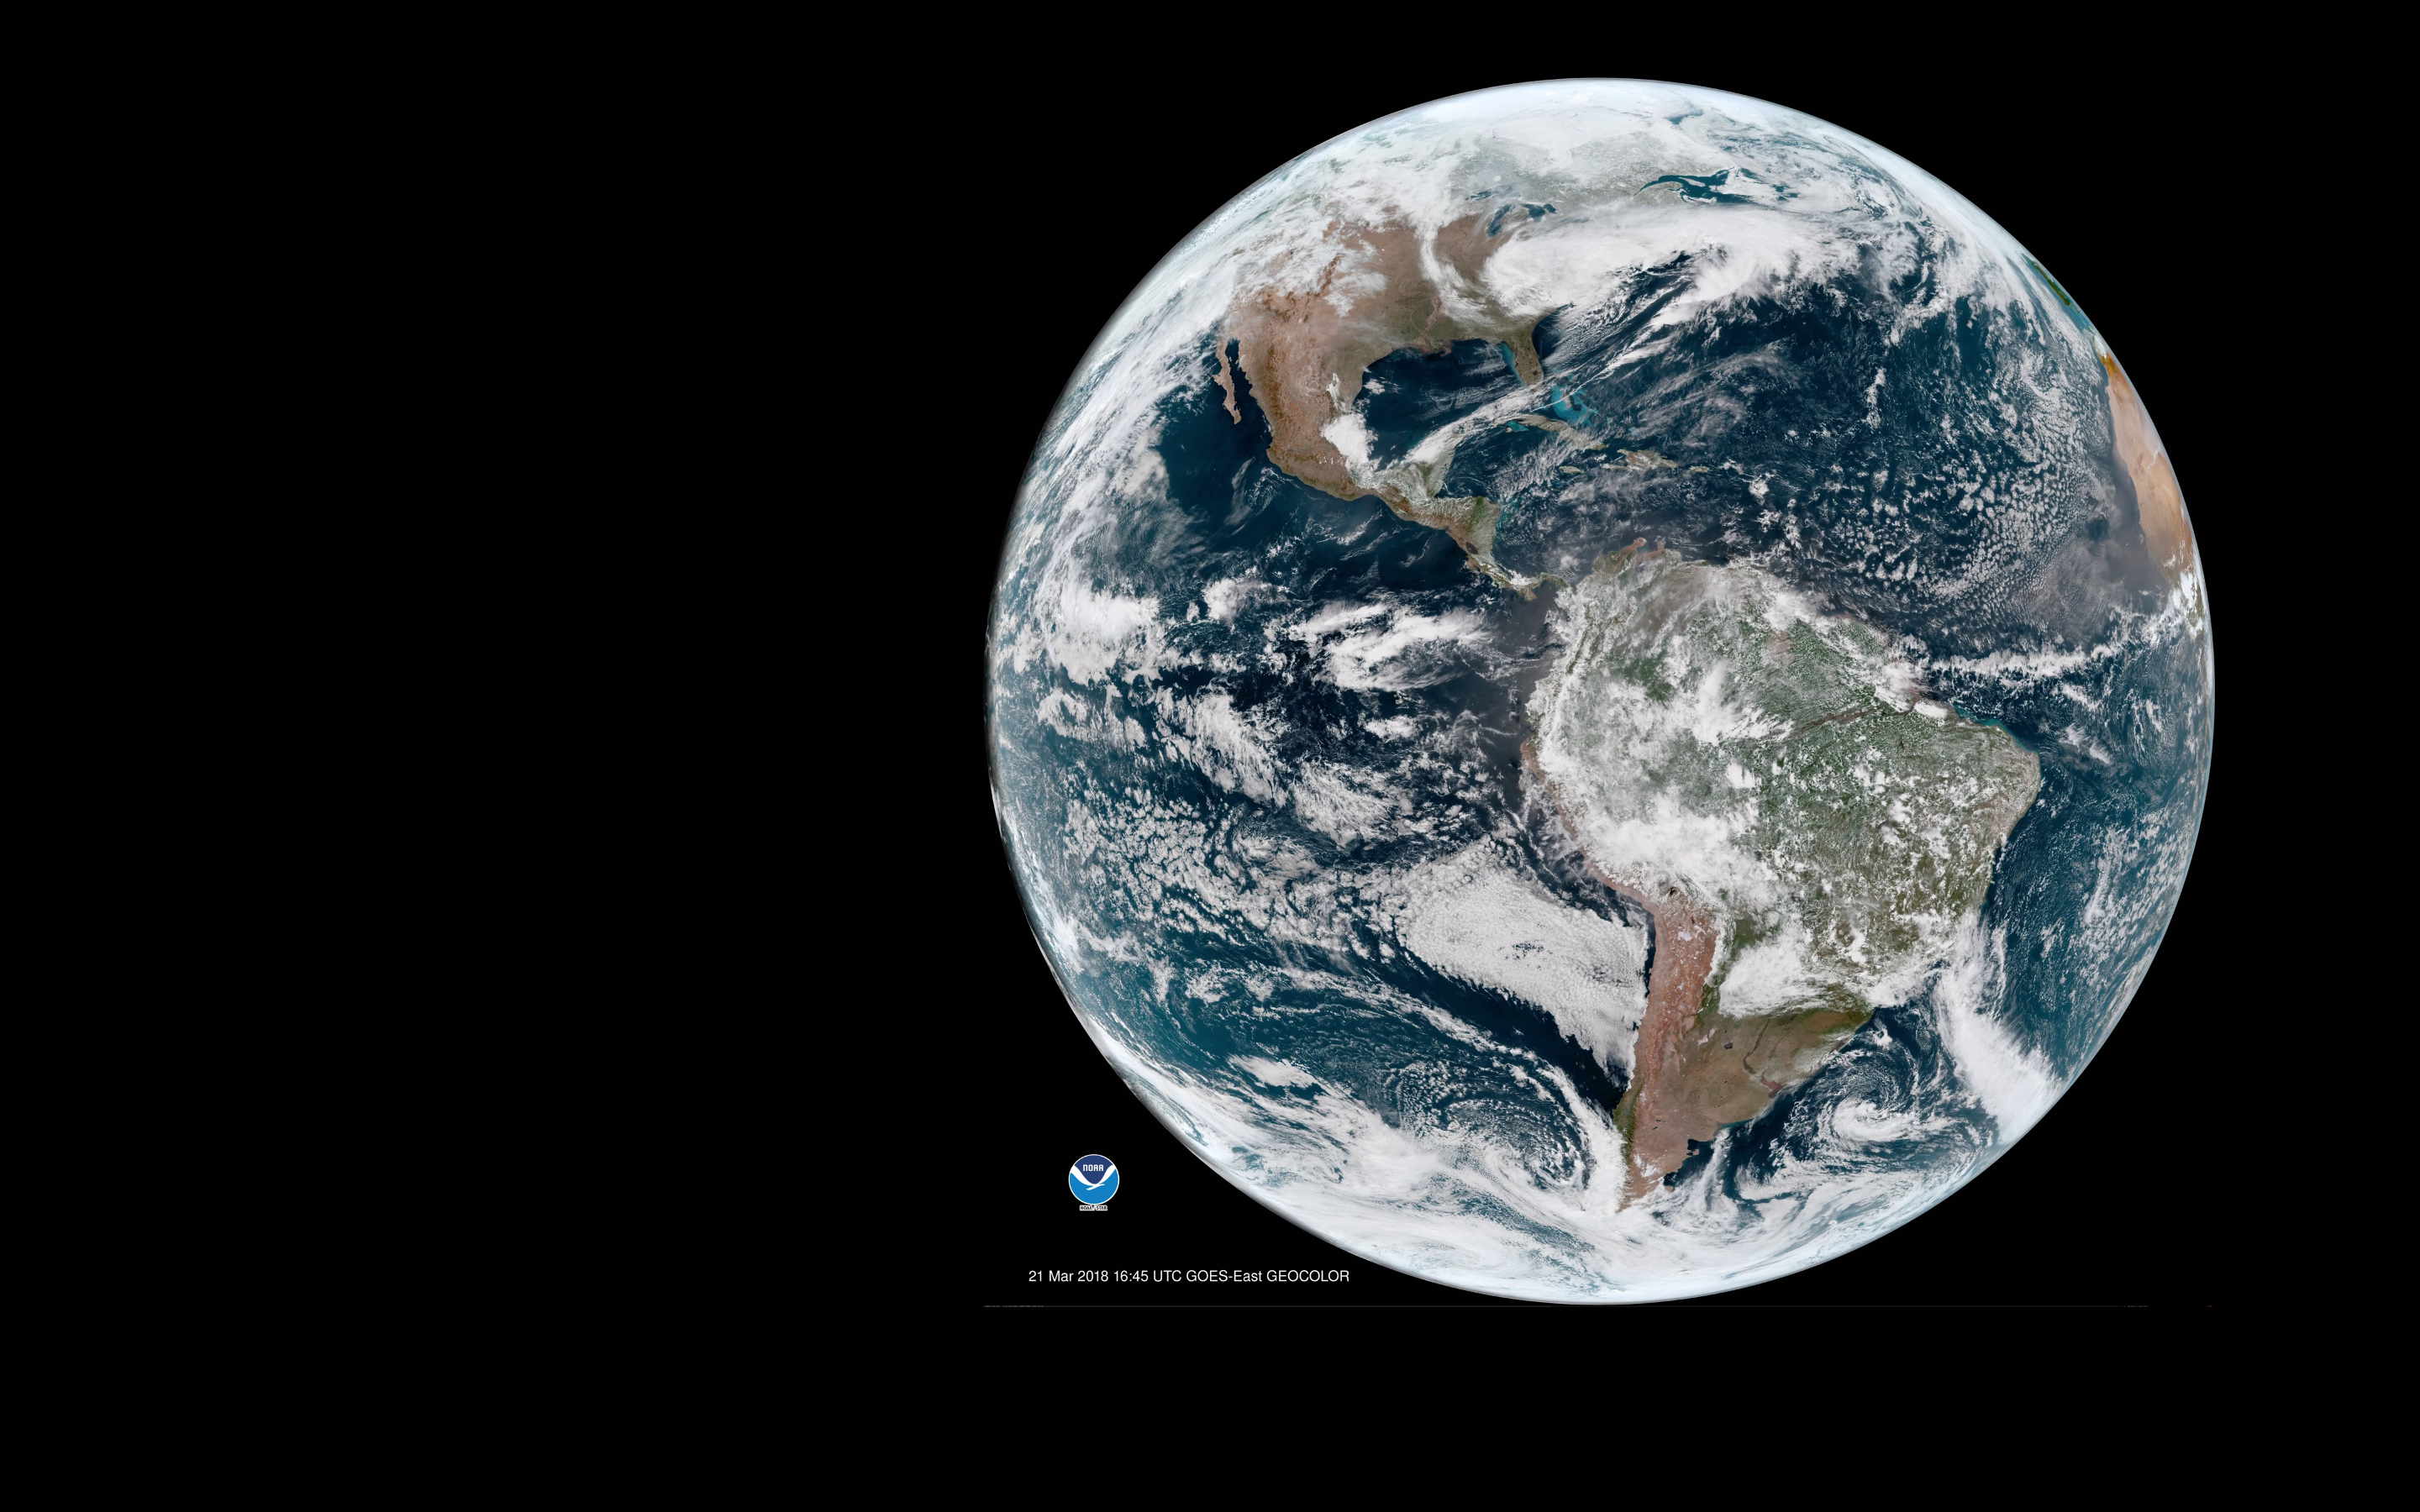
Click on the image above to see it in action!
GOES-16 EAST
The GOES-16 EAST satellite is one of NOAA’s new Geostationary Operational Environmental Satellites (GOES), launched in late 2016. In geostationary orbit above the equator, it provides imagery and weather measurements over North and South America. Managed jointly by NASA and NOAA, images and data from GOES-16 can be found at various locations online, including NOAA’s Center for Satellite Applications and Research (STAR) under the National Environmental Satellite, Data, and Information Service (NESDIS).
For this project, I used a post-processed imagery product called GeoColor, produced by NOAA in collaboration with the Cooperative Institute for Research in the Atmosphere (CIRA) at Colorado State University. This imagery product incorporates multiple spectral bands from the GOES Advanced Baseline Imager (ABI) to generate true color images, including IR bands for clouds at night and a static layer of city lights provided by the VIIRS Day/Night Band data set.
For more information on this GeoColor imagery, check out the informative GeoColor Product Quick Guide provided by NOAA.
Animation
NOAA and their partners in the GOES program offer multiple forms of GeoColor animations and image loops (e.g. CIRA’s RAMMB SLIDER and NOAA’s GOES-EAST Image Viewer), but I wanted the flexibility to create my own animations directly from GeoColor images. But first I needed a good source of image files.
NOAA’s GOES-EAST Image Viewer has a page for the latest Full Disk images in the 16 different bands available from GOES-EAST, including the processed GeoColor imagery.
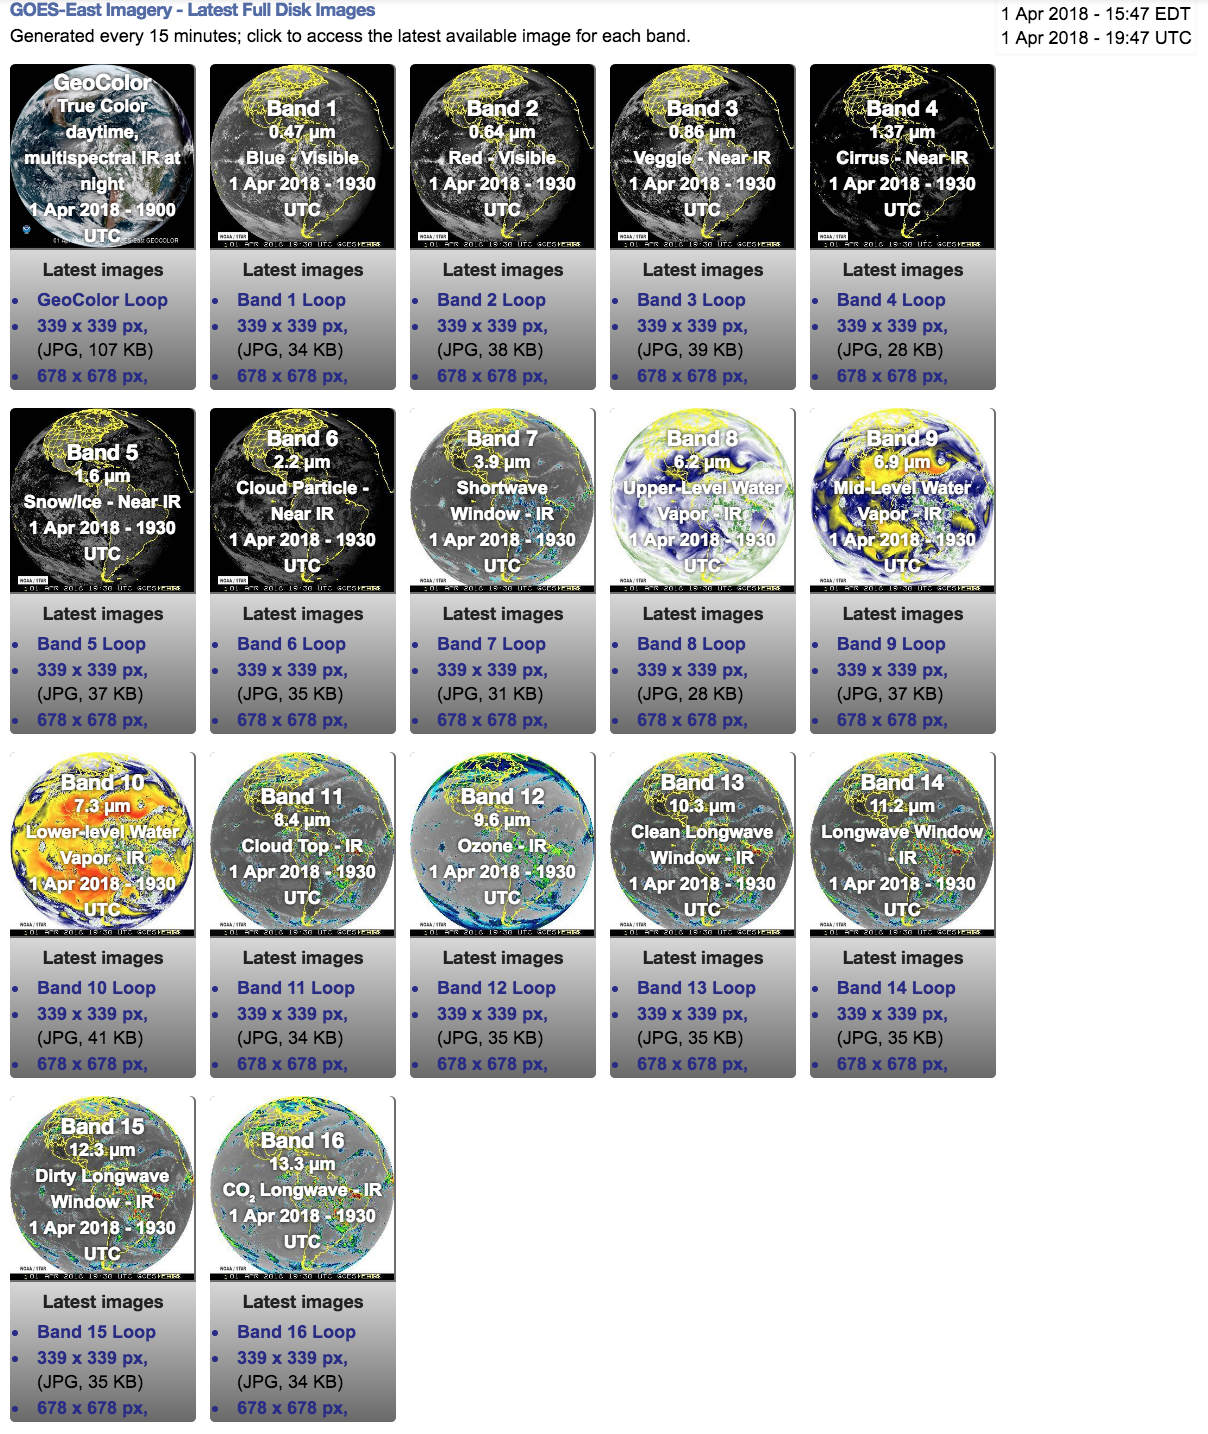
And if you look around those links a bit, you’ll find a NOAA CDN repository that’s hosting all of those images. For example, the latest high resolution (5424x5424), Full Disk, GeoColor image is provided at this link:
https://cdn.star.nesdis.noaa.gov/GOES16/ABI/FD/GEOCOLOR/5424x5424.jpg
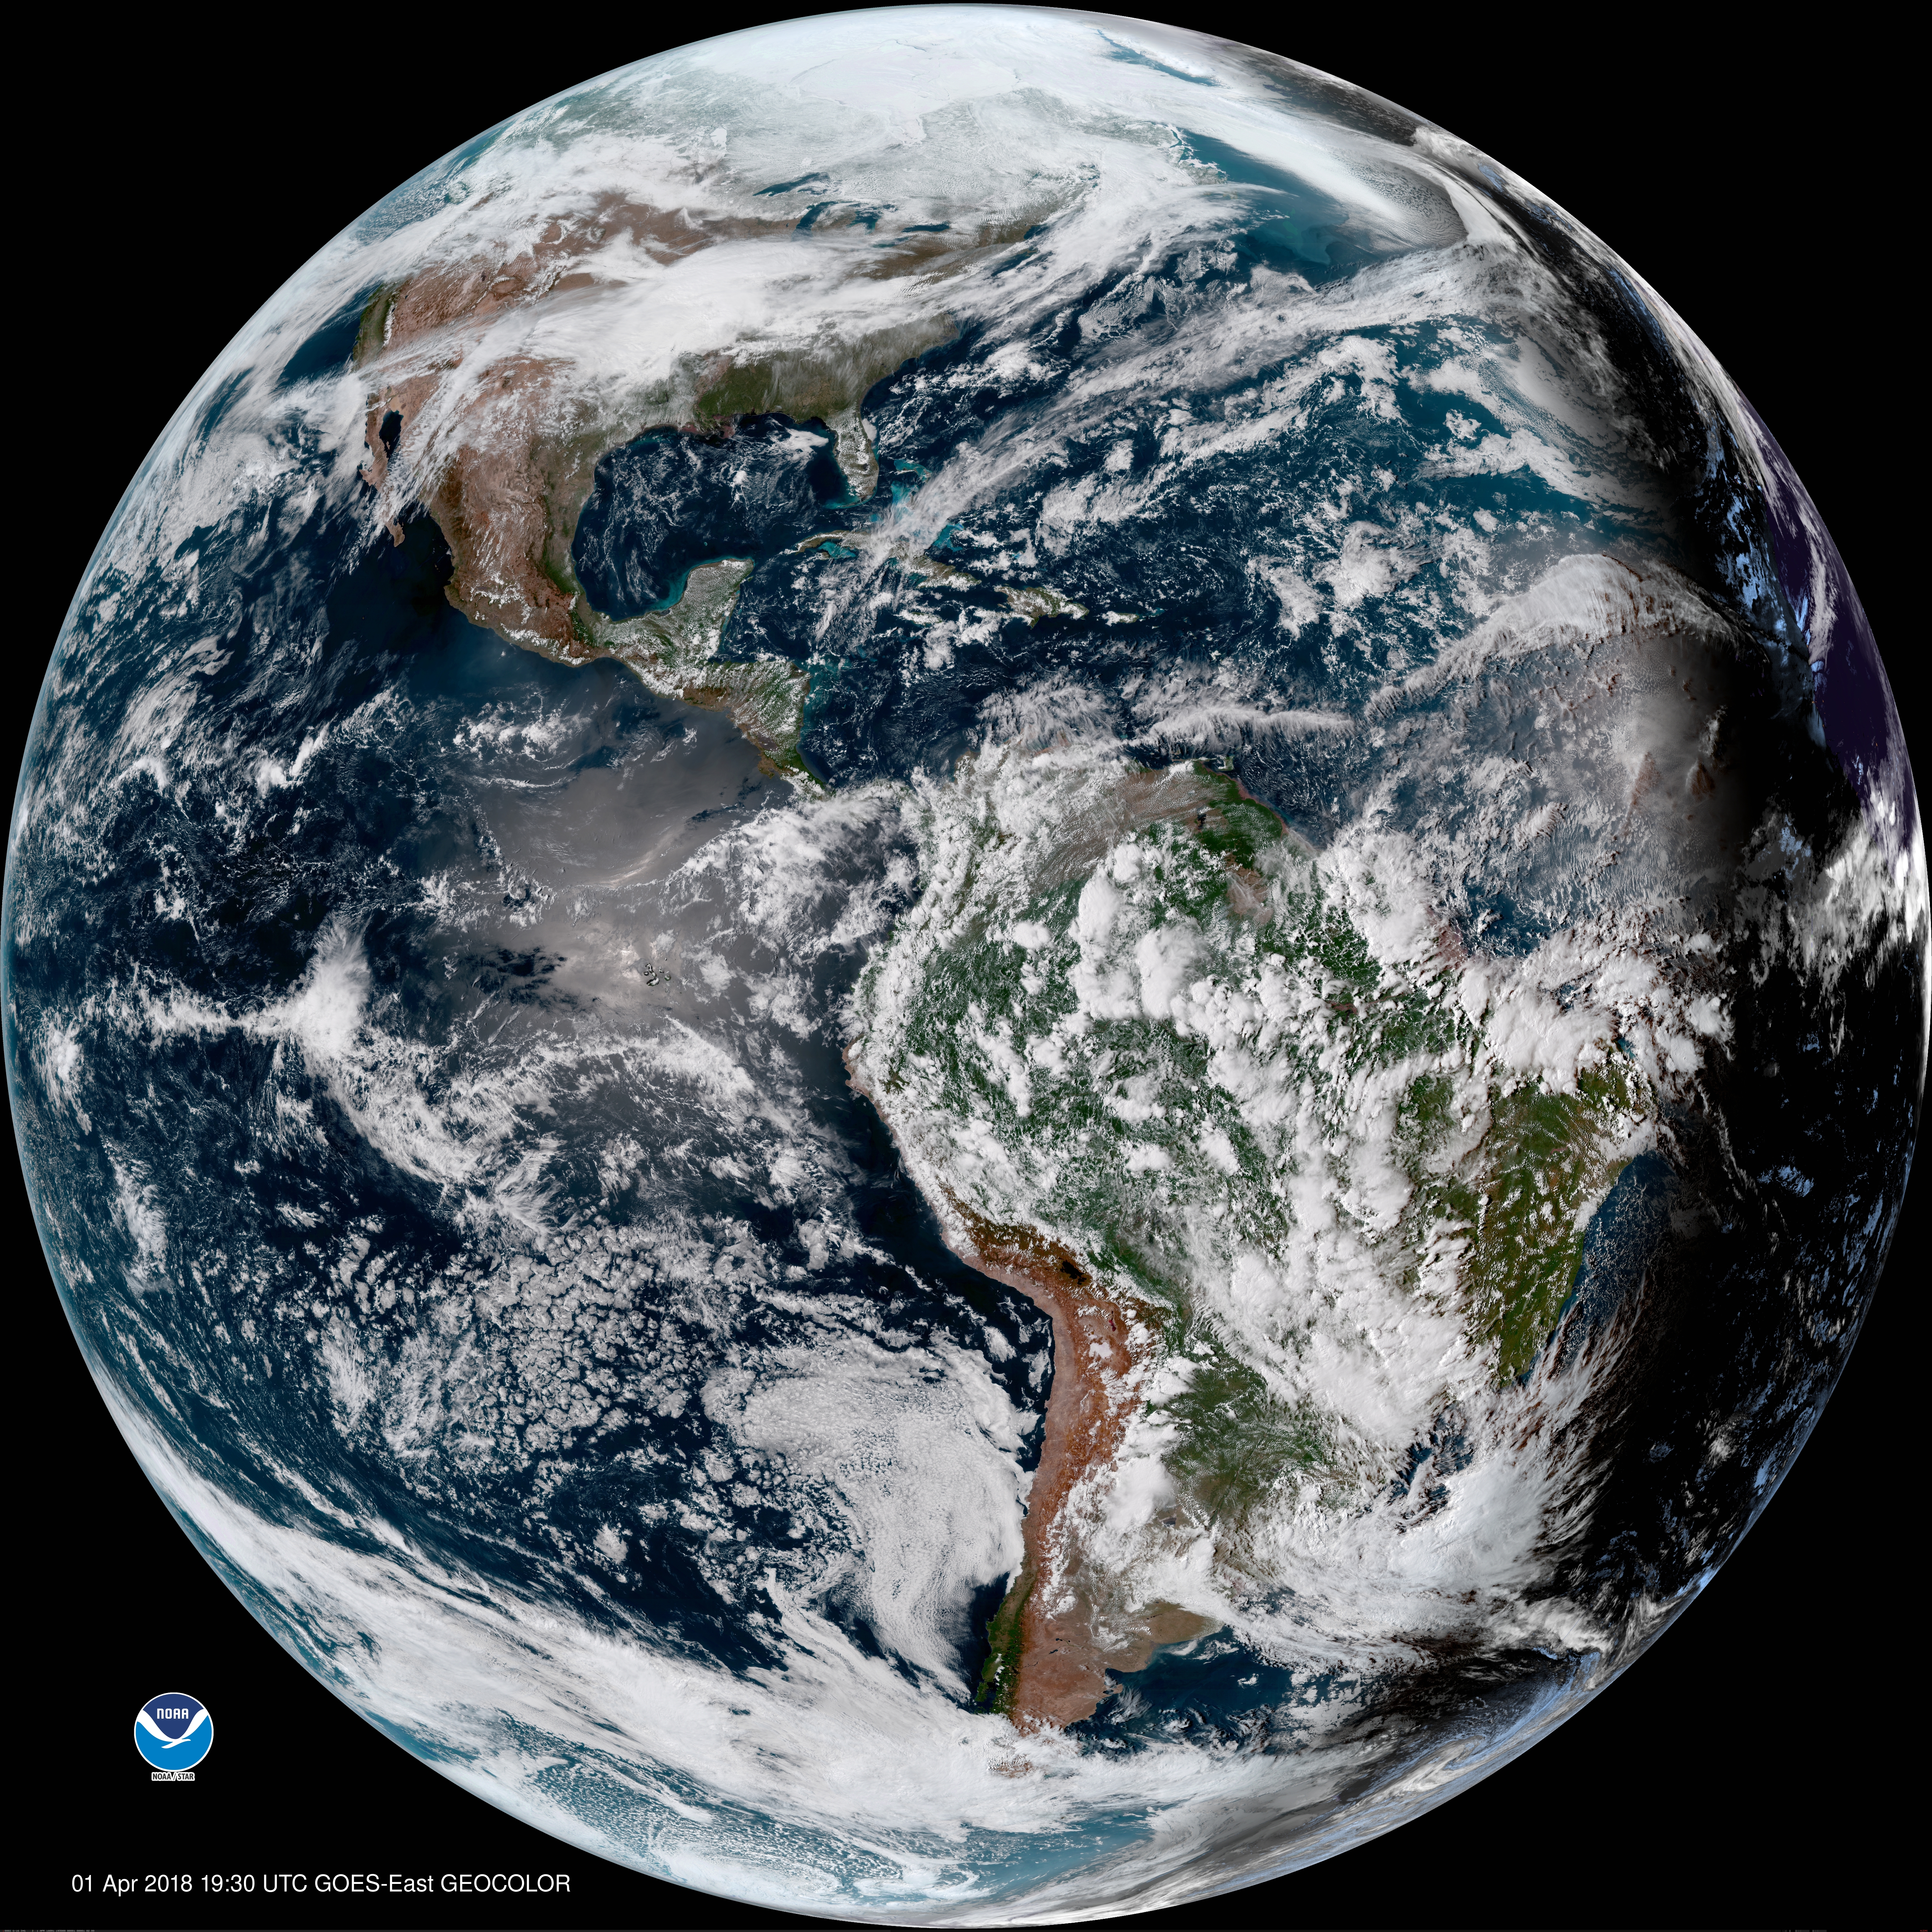
Moving up the directory tree, you can also find the last three days of GeoColor images (with various resolutions) at 15-minute intervals available at the following the CDN repository:
https://cdn.star.nesdis.noaa.gov/GOES16/ABI/FD/GEOCOLOR/
Other image directories (CONUS, regional, different spectral bands, etc) are also available at this CDN, and I’ve written up some more info on what those URL endpoints look like in this other post.
Using the Full Disk/GeoColor URL, I wrote an image downloader in Node.js to get the images I wanted for the animation. To limit the resulting animation file size, I only used a single day of images (~90 images at 15-minute intervals) with 5424x5424 resolution.
With all of the images in a folder, renamed in a numerically sequential format (i.e. image-01.jpg), I used the ffmpeg library to generate a time-lapse animation. It took a lot of trial and error to get the right parameters for the ffmpeg conversion process, and this is what I ended up with…
ffmpeg -framerate 8 -f image2 -s 2200x2200 -i image-%5d.jpg -vcodec libx264 -crf 28 -pix_fmt yuv420p output.mp4
I resized the frames down to 2200x2200 and used a higher Constant Rate Factor (CRF) to keep the file size down to a reasonable ~55MB. And I put the resulting .mp4 file up in a public S3 bucket and linked it to an AWS CloudFront CDN domain for speedier delivery. It might be overkill for this situation, but it could be helpful if I try to post larger video files in the future.
Inspiration
I was inspired to explore this process and make this animation by the beautiful website glittering.blue by Charlie Lloyd. Click the image below to see the full animation in action.
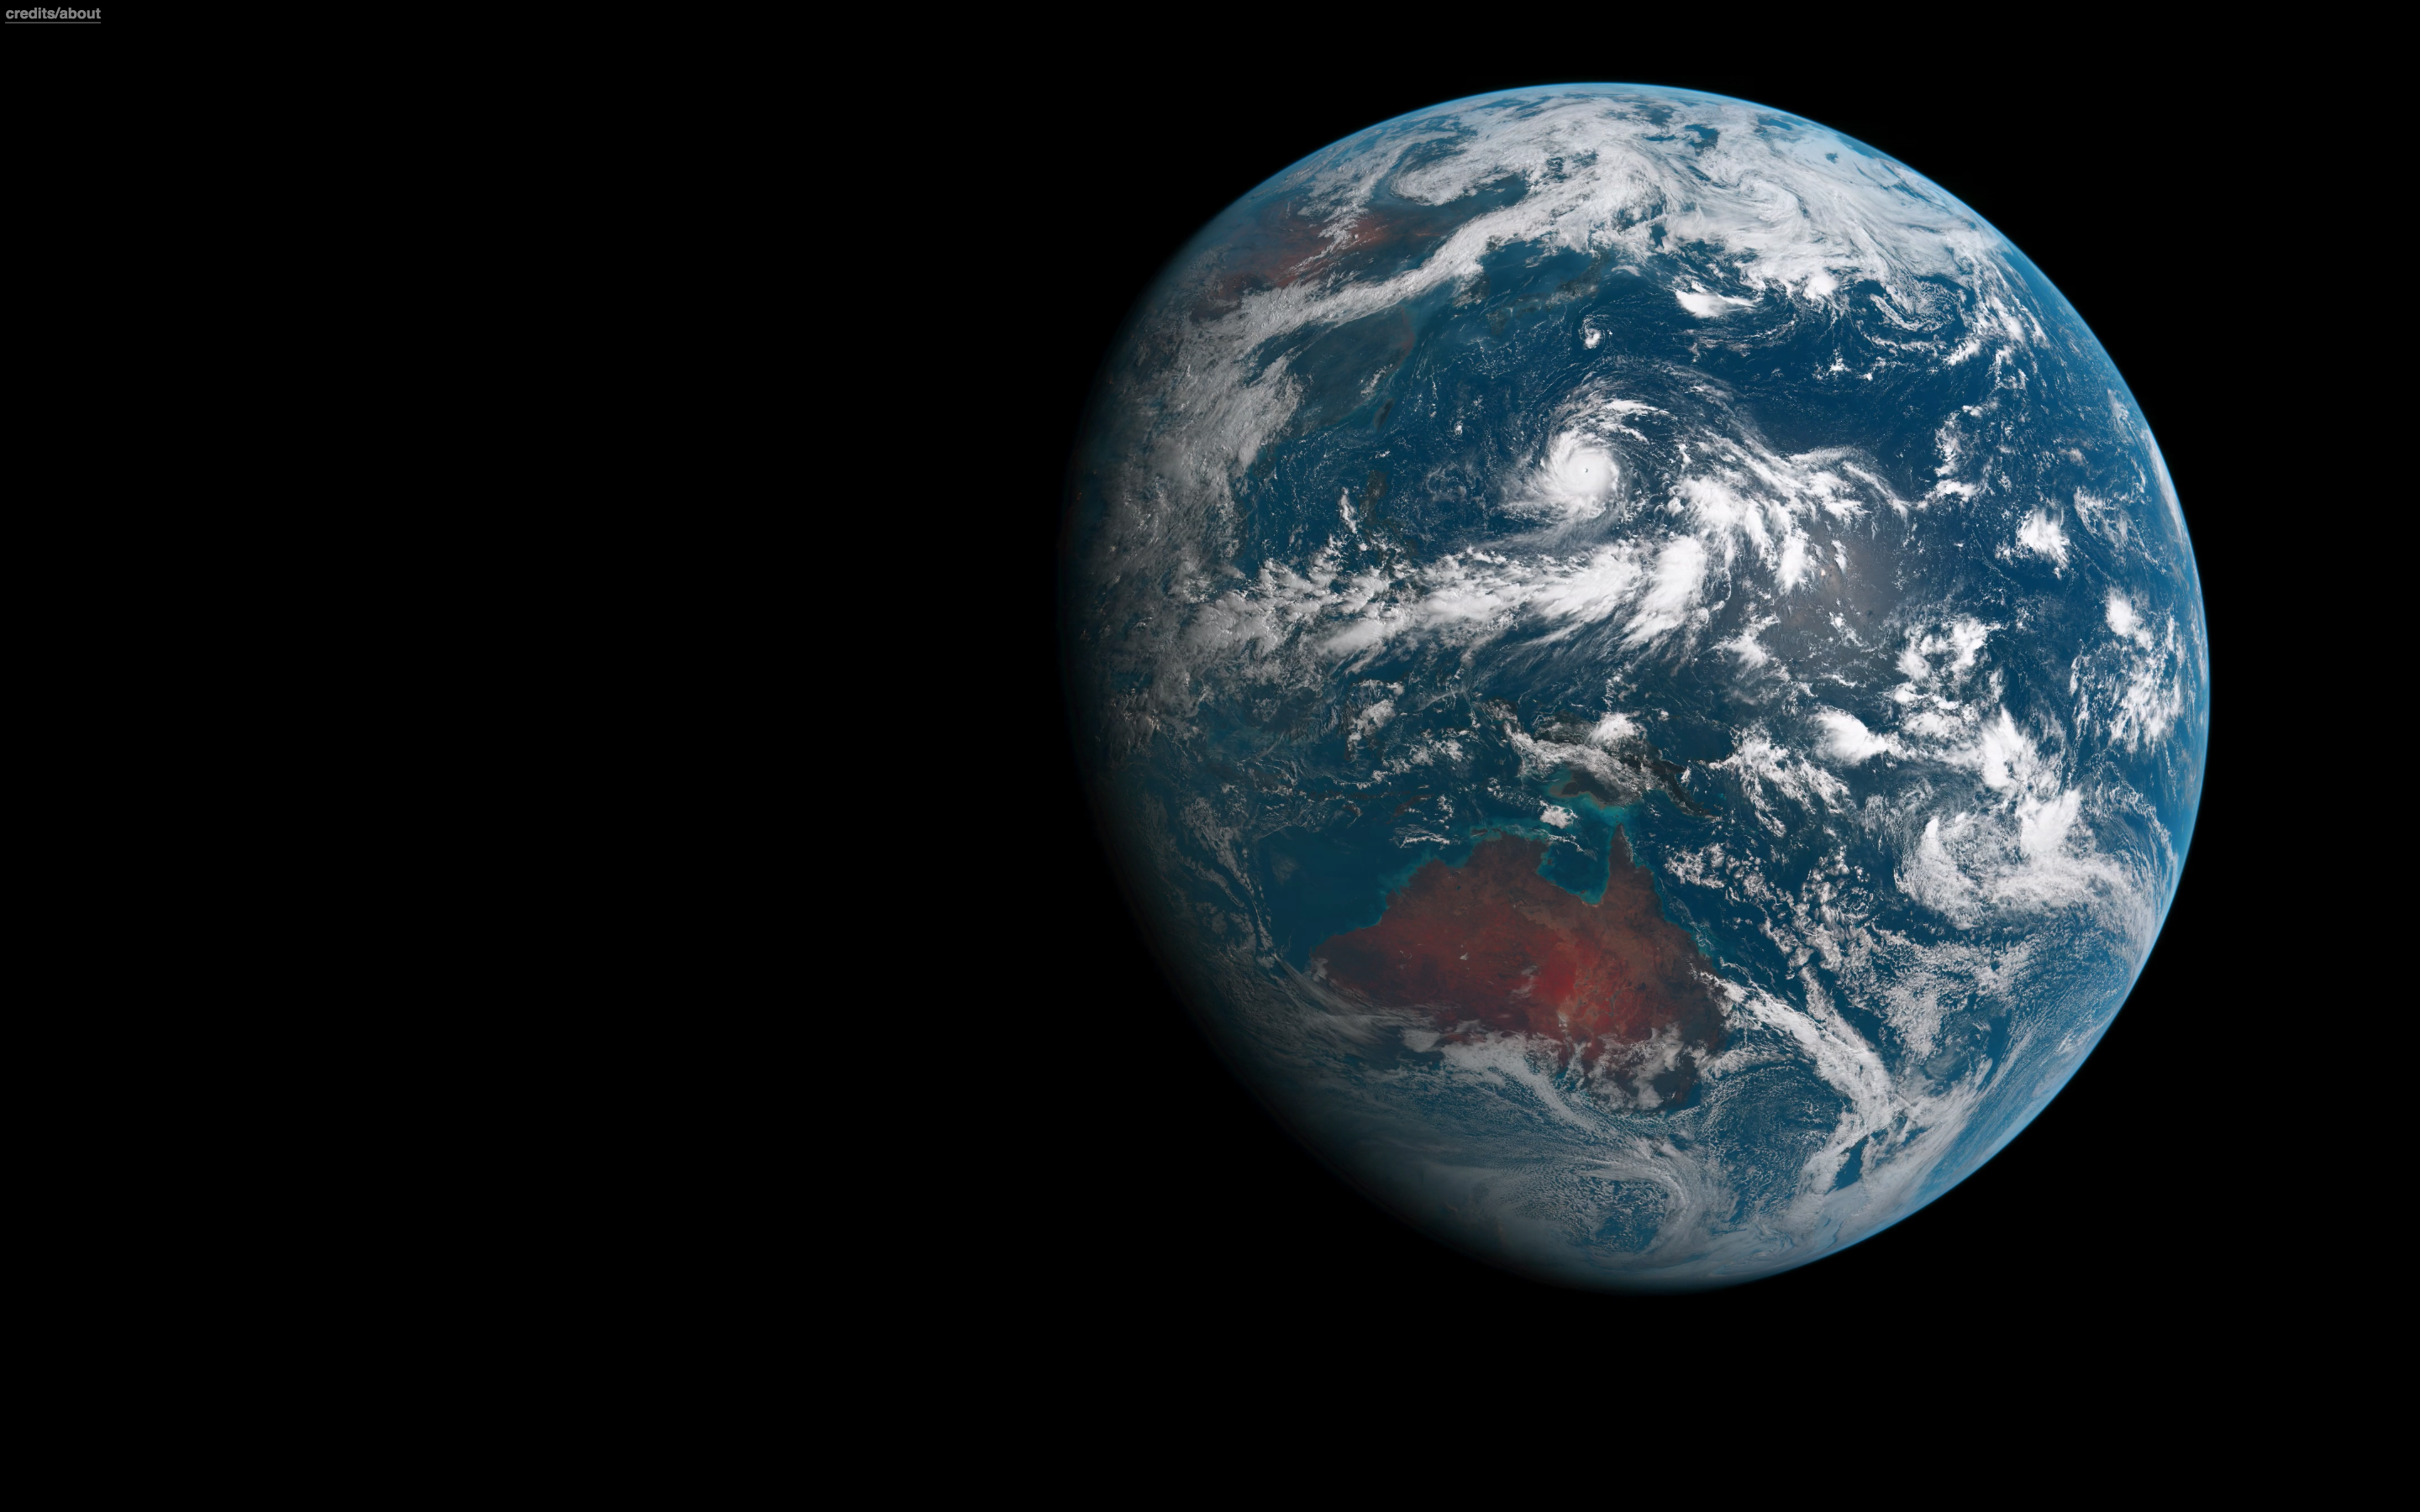
This animation caught a lot of attention when it was launched in 2016 ( here and here), and Charlie provided an excellent write-up about the animation at glittering.blue/about. It was made from custom-processed imagery available from the Advanced Himawari Imager (AHI) onboard Japan’s Himawari-8 weather satellite. And he even recently updated the site with a custom animation of GOES-16 imagery from the 2018 vernal equinox.
More GOES-16 Animations?
I’m also working on some Python scripts to download and process raw imagery to generate other animations, more like the ones on glittering.blue. While I like the GeoColor effect (particularly being able to see city lights at night), I want to try my hand at mixing different spectral channels to get true color. And I really like the night shadow wrap effect that you don’t get with the GeoColor imagery because of the night lights.
With the GOES imagery, this process is a little difficult as the ABI instruments on GOES-16 EAST (and the recently launched GOES-17 WEST) don’t include a “green” imagery channel. So in order to generate a true color image, you have to synthesize a green channel from some combination of the other 16 channels of the ABI.
I’ll write-up another post about the ABI and what that green channel synthesization process looks like, hopefully with more animations!
- Posted on:
- March 26, 2018
- Length:
- 4 minute read, 797 words
- Categories:
- Tutorials
- Tags:
- remote sensing satellites