Look Under Your Seat
By Jon Engelsman
November 23, 2019
How the simple question of "what else does Oprah own on this island other than a mansion and the book store?" led to a county's GIS website and building a custom parcel map.
*Note, I’m pretty sure Oprah doesn’t own all of these state parks.
Parcels
In my work, I’ve been wrangling a lot of parcel data recently. I’ve really grown to appreciate the importance of these polygons of land ownership (aka cadastres) and the stories they can tell you if you know where to look.
Finding parcel data can be a challenge though. A national database of the 150 million some parcels in the United States doesn’t exist ( not yet anyway). If you want parcel data, then your only options are to get them through one of the many paid parcel services or roll the dice and hope you can find them on a county GIS website somewhere. Assuming you get your hands on some parcel data, what’s a good way to visualize it and put it in context? If you’ve ever used a county GIS parcel map, you’ll know they can be somewhat lacking in usability and clarity sometimes.
With those ideas in mind, the story that follows is partly a tutorial and a demo on what to do when you stumble upon a question about some parcels.
Unreal Estate
I’ve spent a lot of time up in the San Juans these past couple of years, visiting friends and family who live on the islands. I also just got married up there and spent a solid couple of months living there, so I got to know the islands a bit better than I usually do.
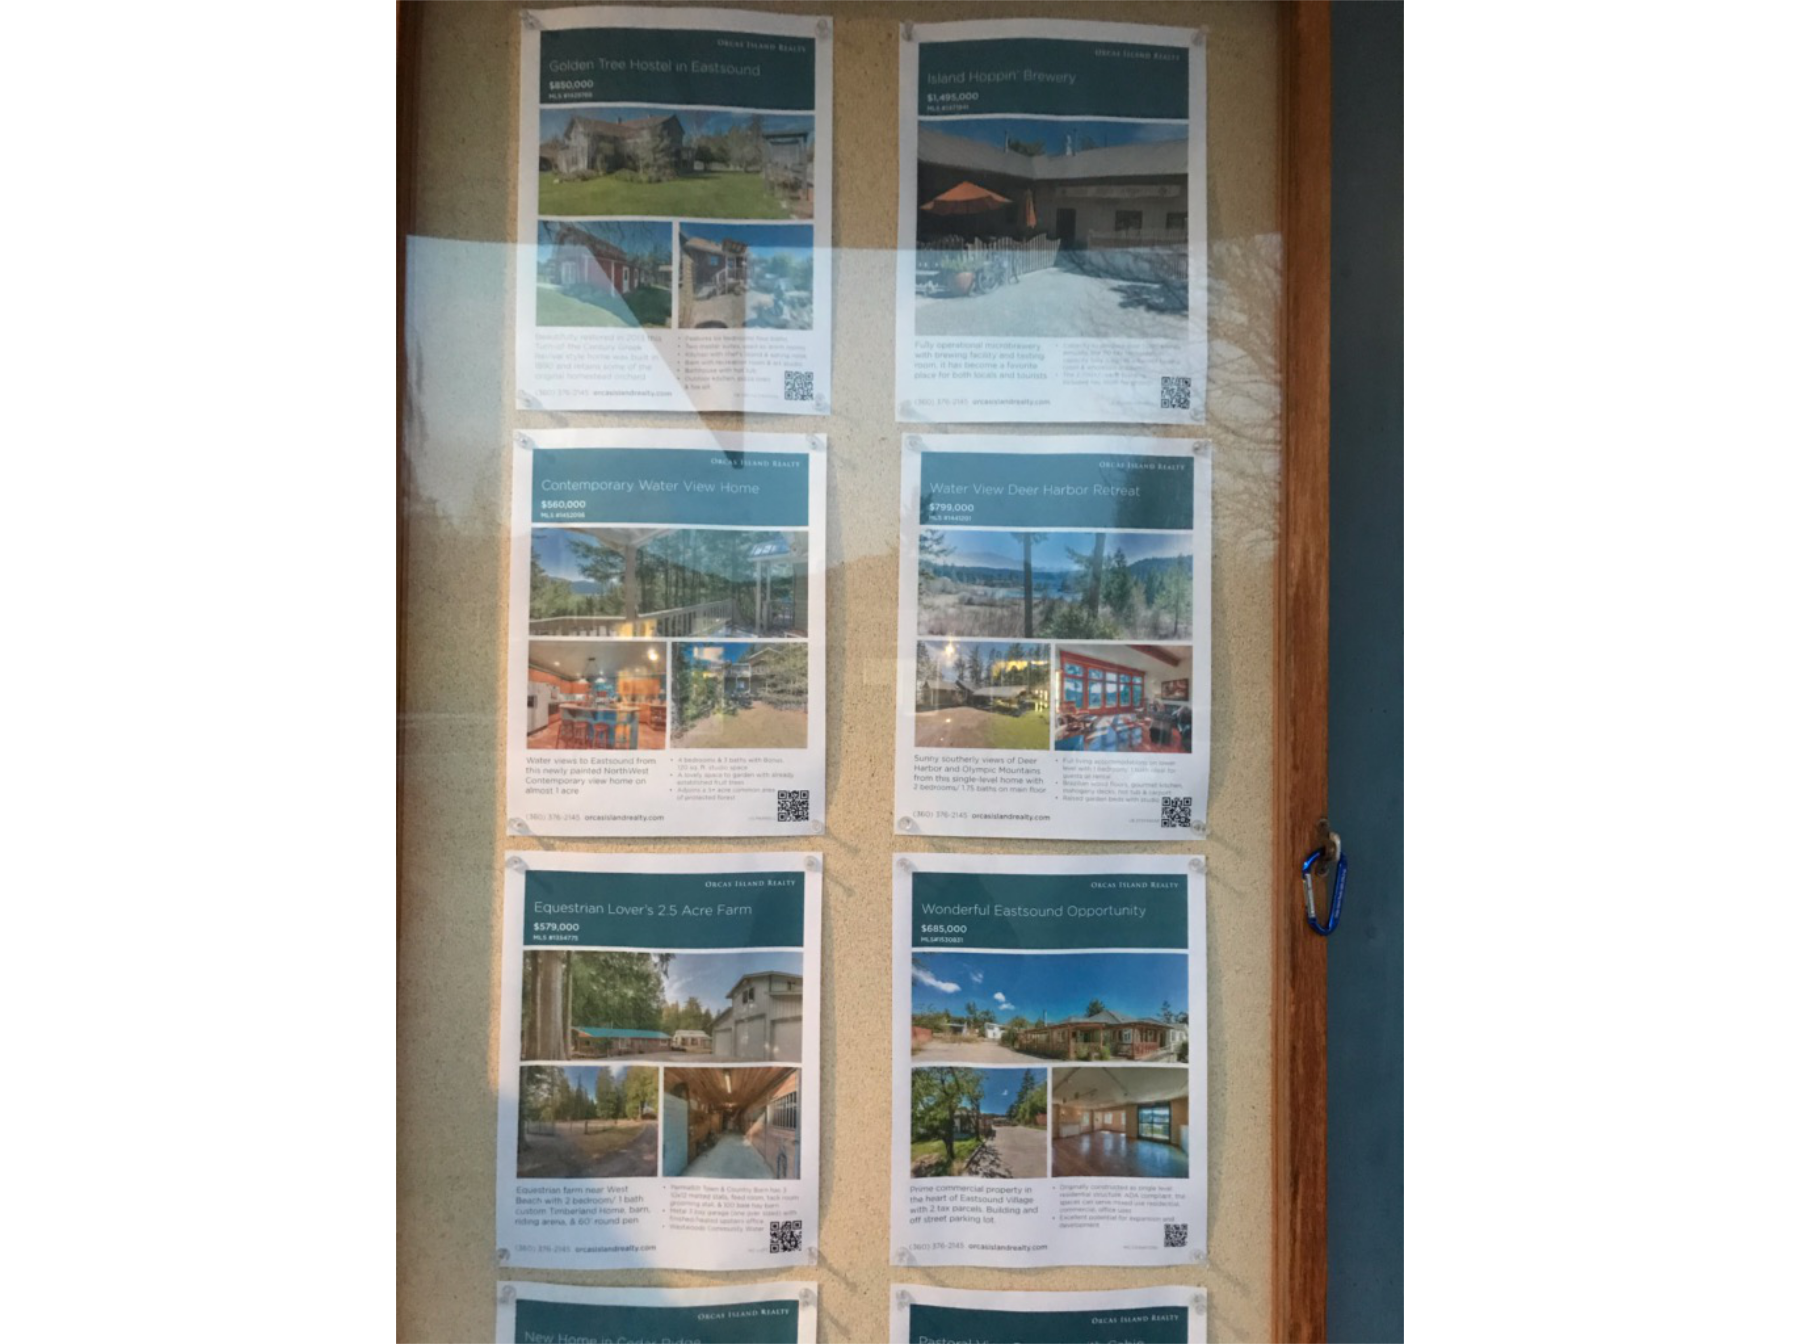
When I’m in town, I like to scan the many real estate boards scattered around the small town center, both to see the beautiful beach-front properties for sale but also to keep an eye out for one of the small businesses around town giving up the struggle to an economy that lives and dies by seasonal tourism.
A couple of years ago, I noticed a new house on the market that caught my eye. A quaint home, listed for the meager sum of $12 million, called Madroneagle.
 Vlad Popach Real Estate
It’s a beautiful property. And I admit, I allowed myself a good bit of daydreaming about what I’d do with all of that space. But I thought to myself, only celebrities can afford island getaways, right?
You Get A House and You Get A House
A year or so later, I saw an article about Oprah buying a new property in the San Juans. Sure enough, Oprah Winfrey had bought Madroneagle.
The next time I was in the islands, I mentioned this offhandledly to some friends. “Oh yeah, I heard she owns a bunch of land in town too,” they replied.
Wait, what? How many properties does Oprah actually own in the San Juan Islands?
Let Me County The Ways
To answer that question, I needed a map. I’ve been doing a lot of work with county GIS pages lately so I knew the first place to find answers about property would be the San Juan County Geographic Information Systems (GIS) page.
Each of the 3,141 counties* in the United States have their own GIS agencies with varying degrees of online presence (i.e. data and web maps). This can range from a 1990’s webpage telling you to send your map requests to an office fax number, all the way to a slick modern web interface if you’re lucky.
*Includes county and county equivalents in the US and District of Columbia, not including US territories.
Luckily for me, the San Juan County GIS has a fairly nice ESRI ArcGIS web map they call Polaris.
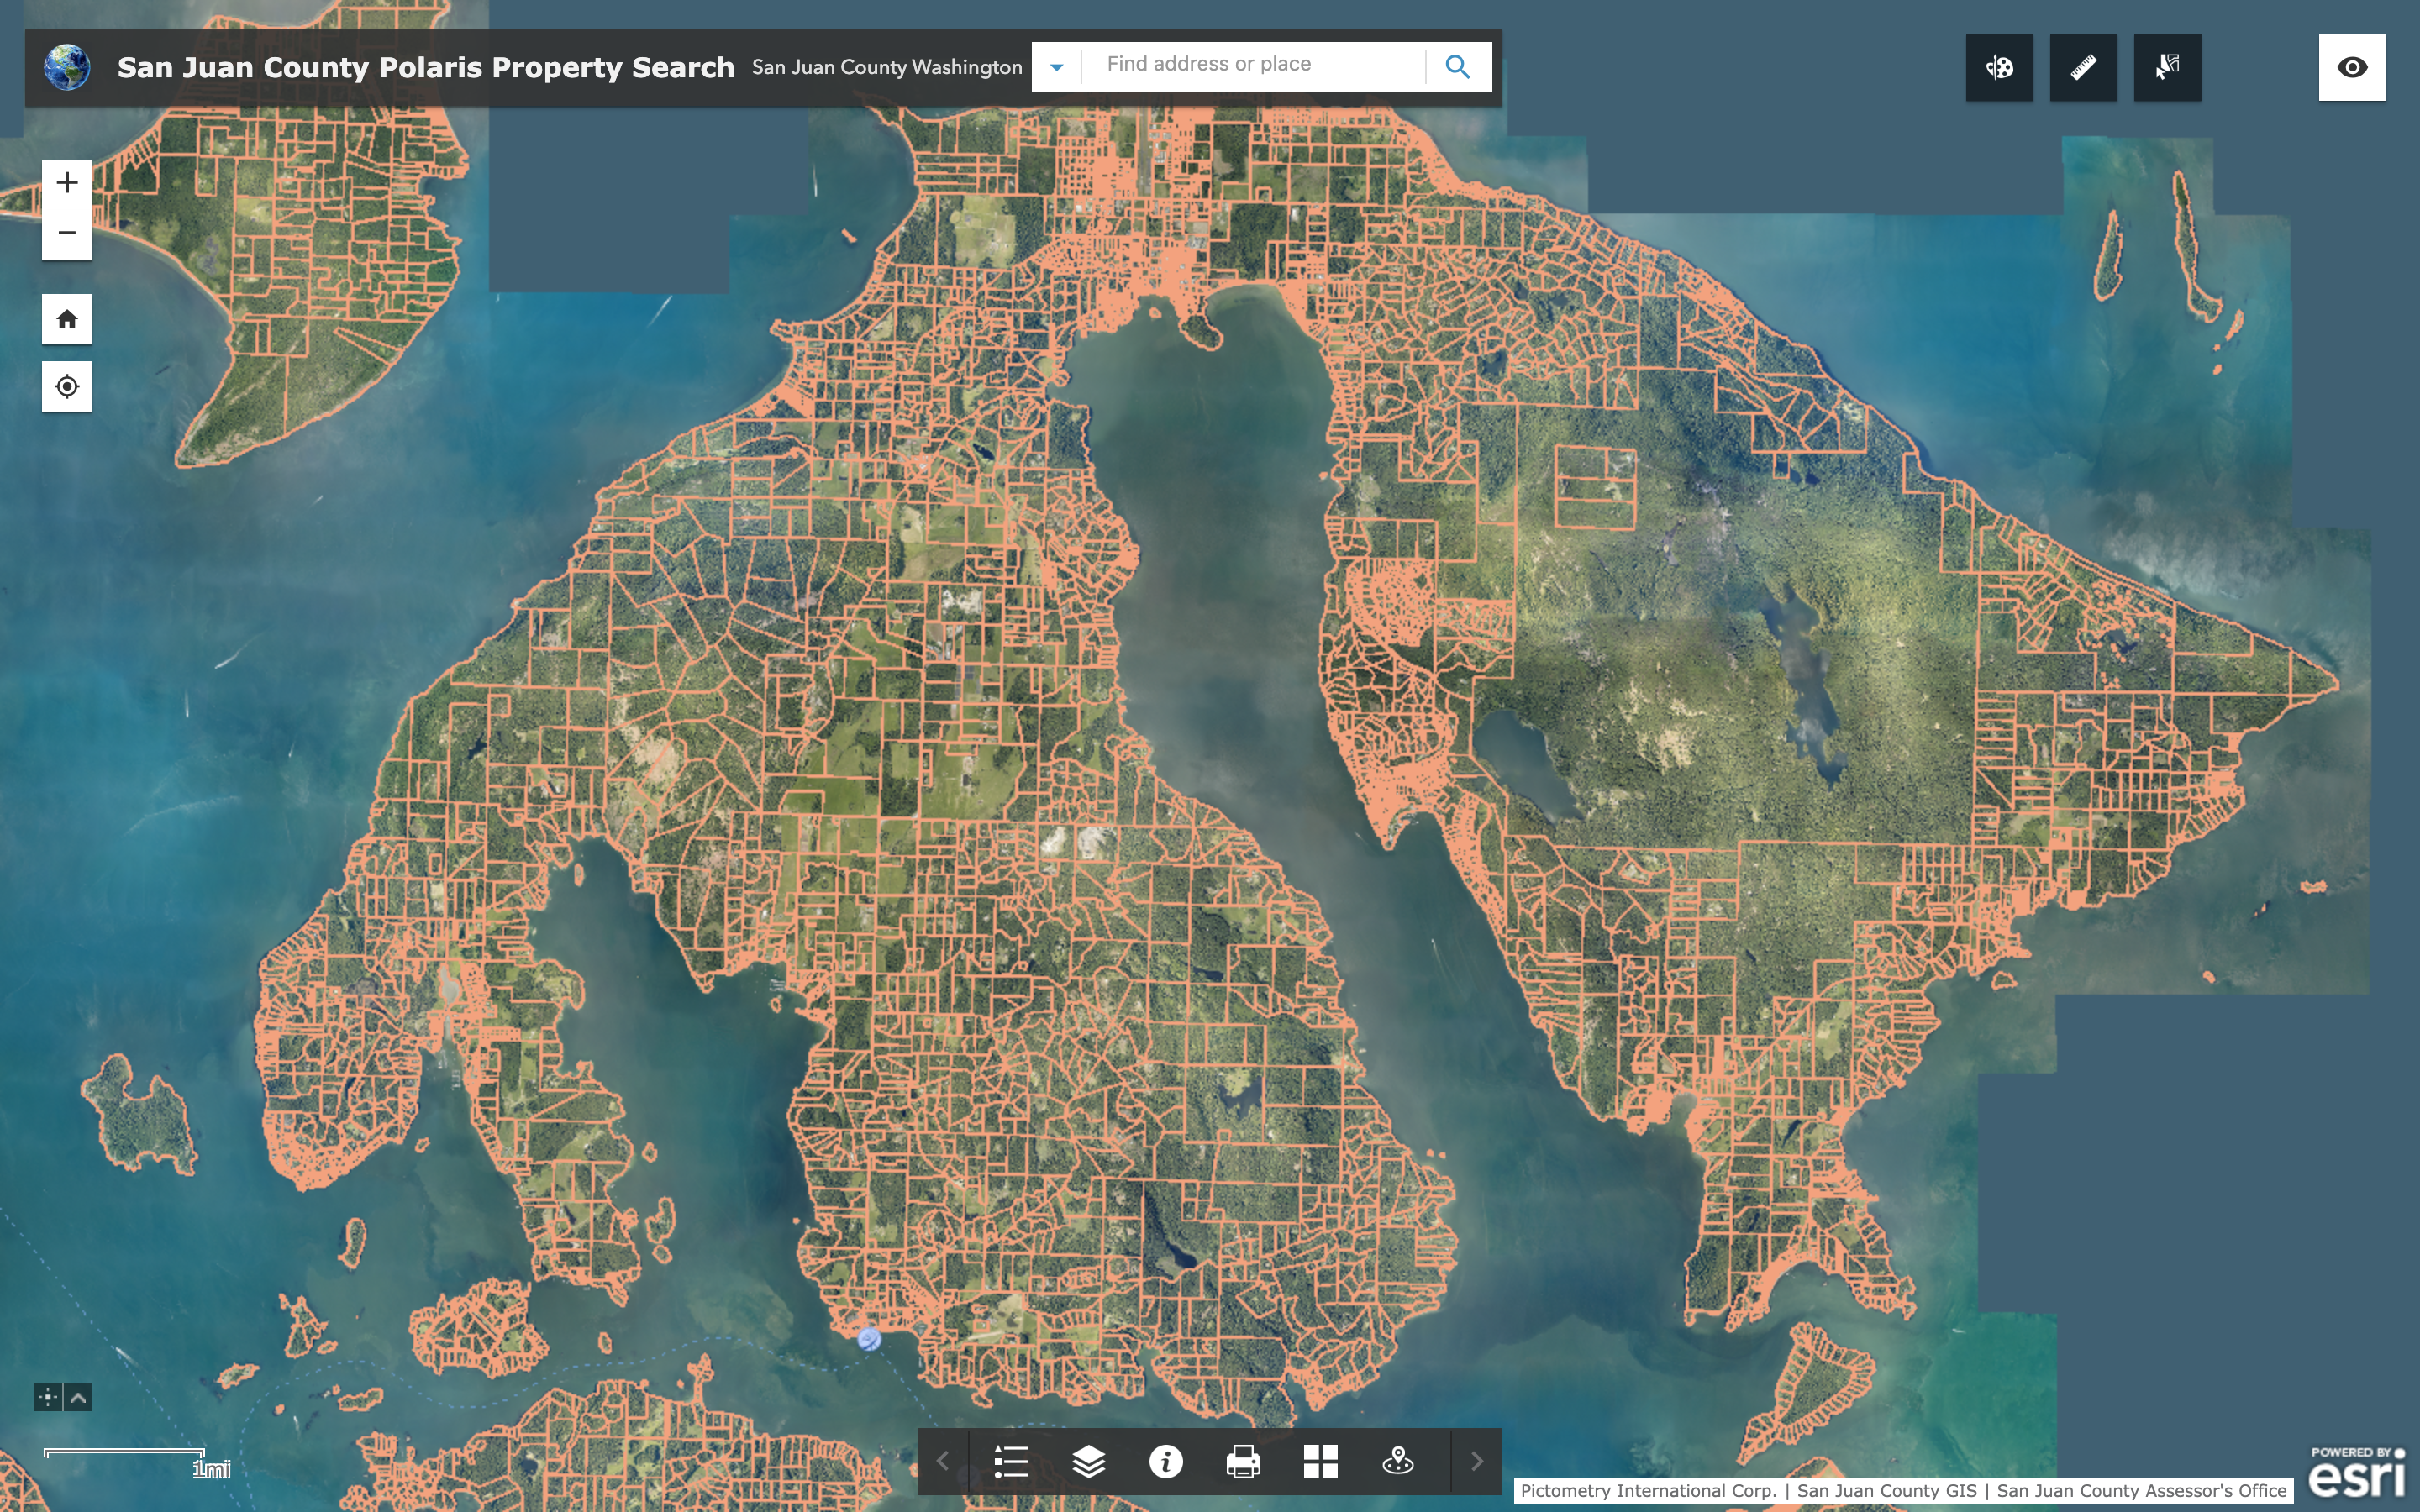 San Juan County/GIS/Polaris
This map shows all of the land parcels for the whole county. Zoom in on the map, click on a specific parcel and a popup will show you some information about that parcel, like the owner, estimated value, sale date, etc. Clicking on the Madroneagle parcels in the map, we see that the owner is a company called Madrona Tree LLC.
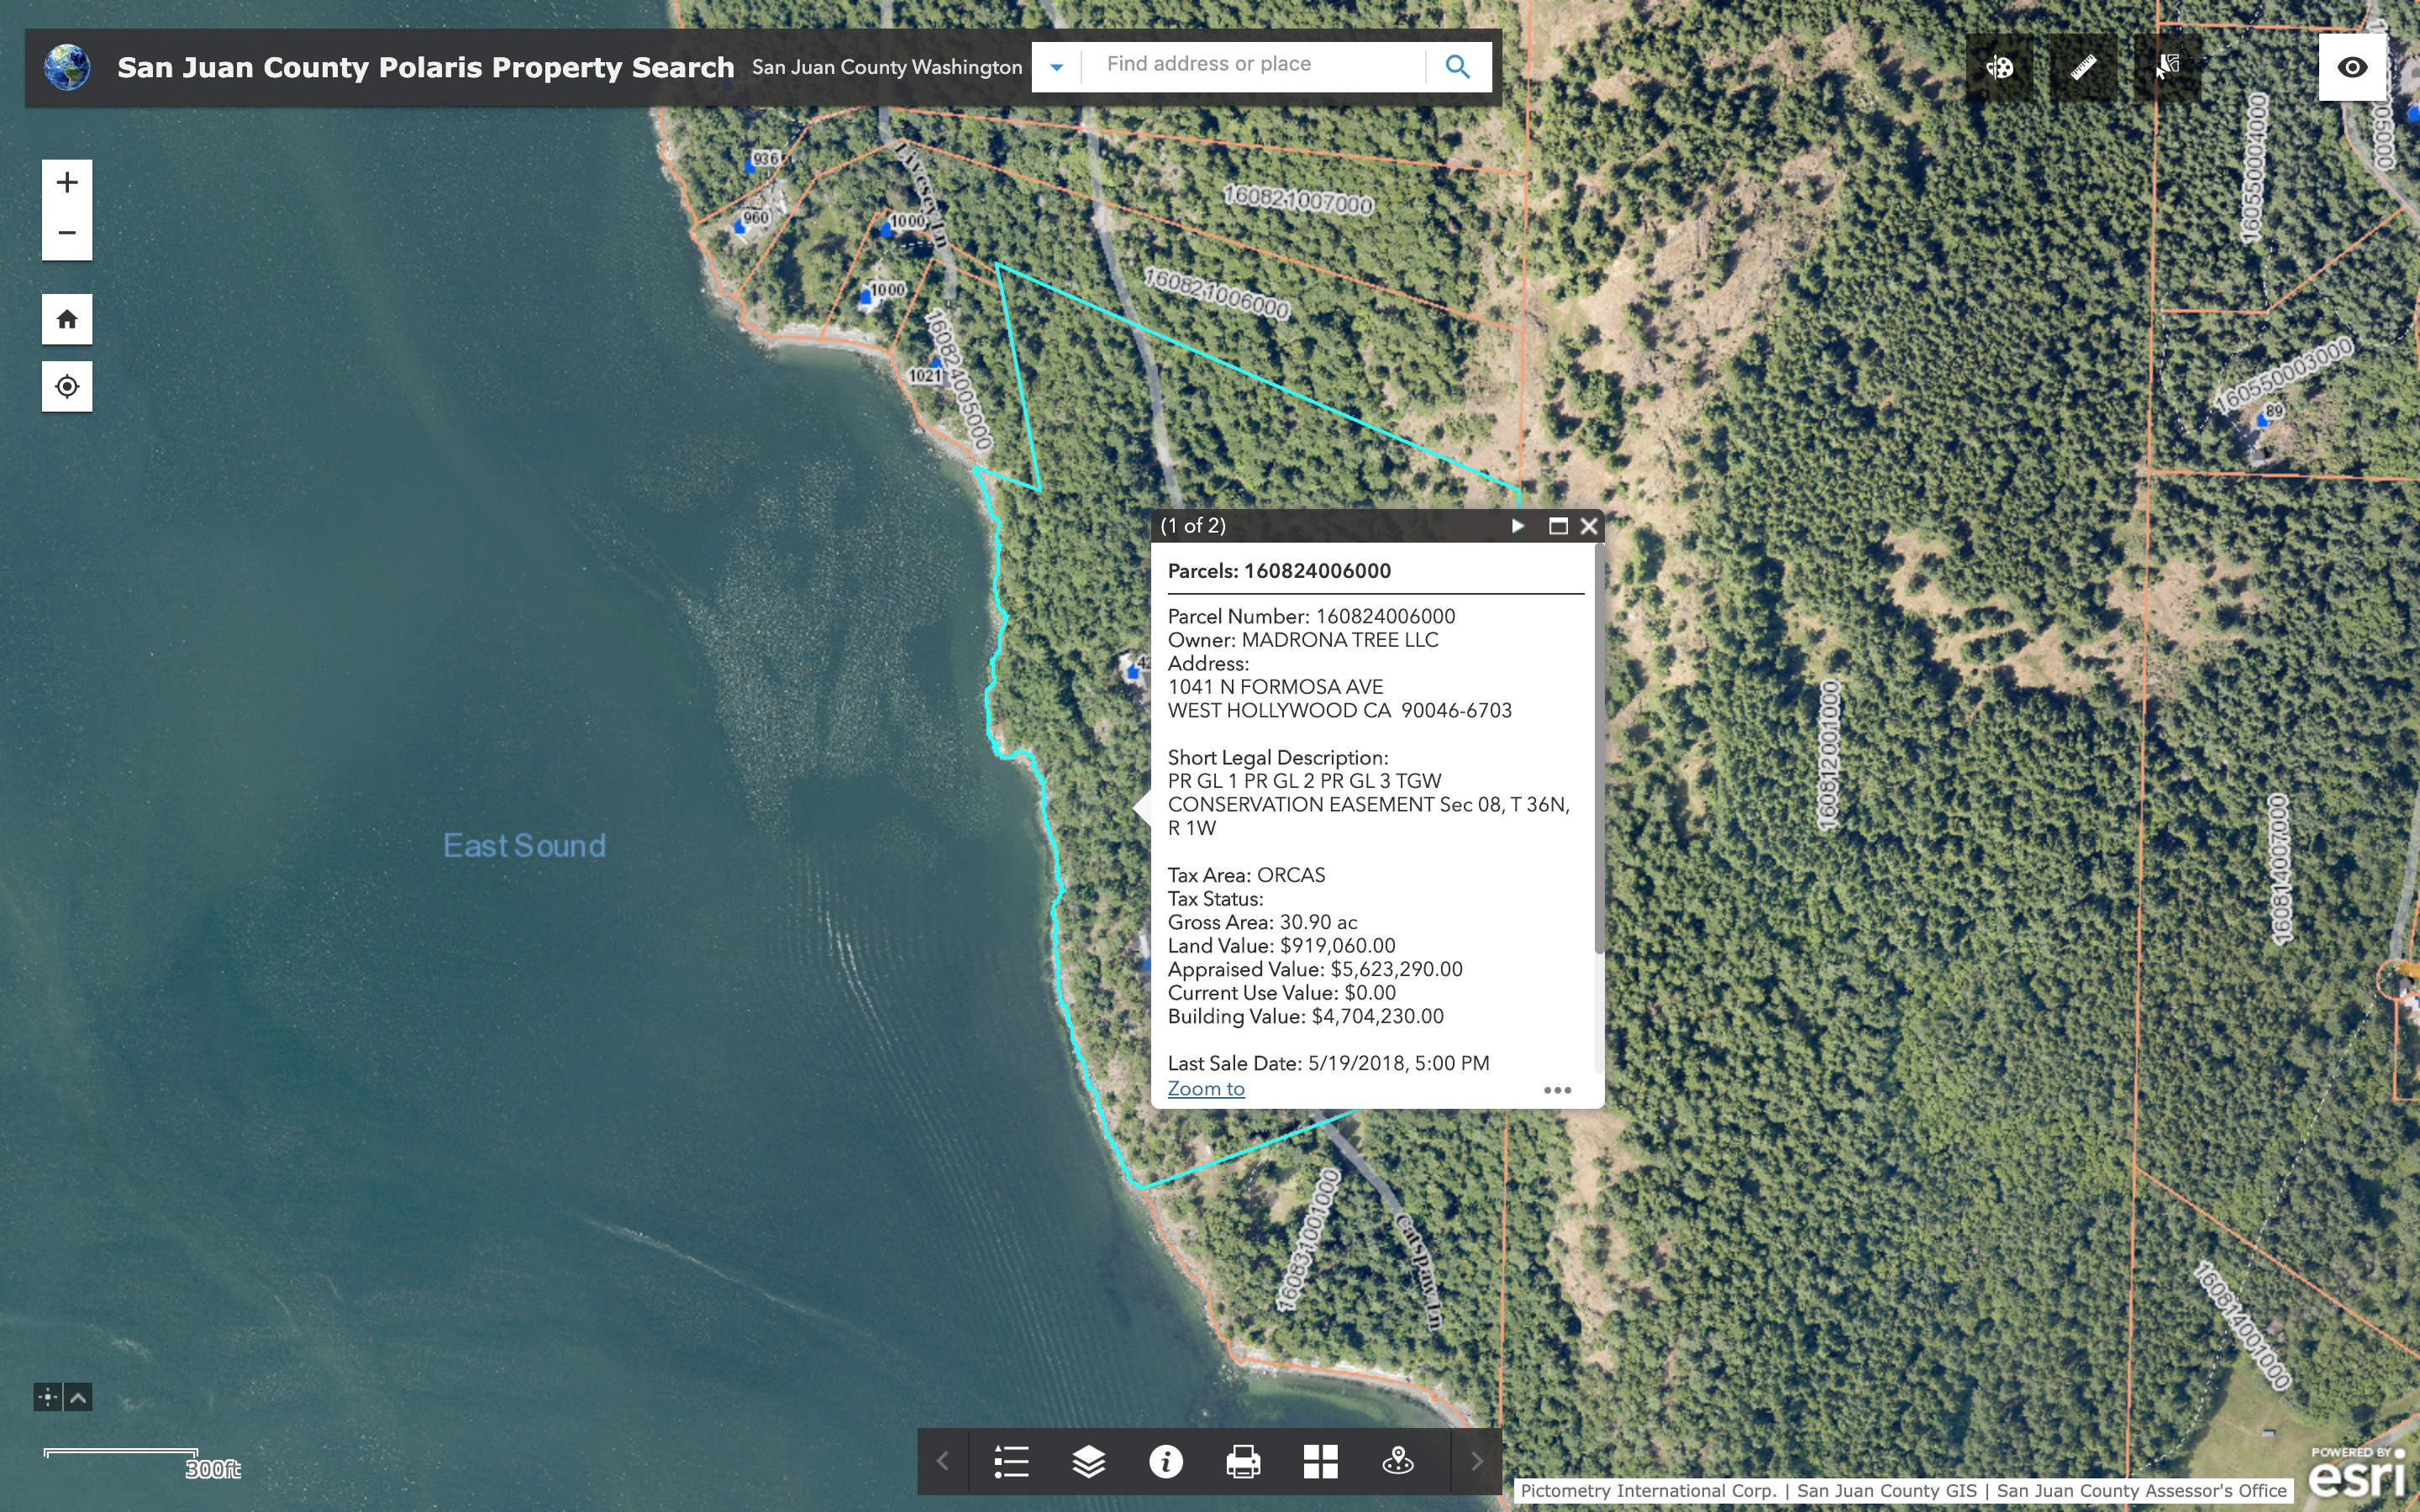 San Juan County/GIS/Polaris
From one of those earlier articles, we have a pretty good connection between this company and Oprah:
“According to public records, the larger parcel went for $7,150,00 and was purchased by West Hollywood-based Madrona Tree LLC, whose administrator manages Oprah’s personal finances. The second parcel was purchased by Seed Money LLC of Telluride, CO for $1,125,000. After a bit of digging, we noticed that the administrator of Madrona Tree LLC is the same as that on file for Seed Money.”
Ok, I get it. Oprah owns Madroneagle, rub it in a bit more why don’t you? But what about those other properties in town? I heard she owns the book store and ice cream shop too.
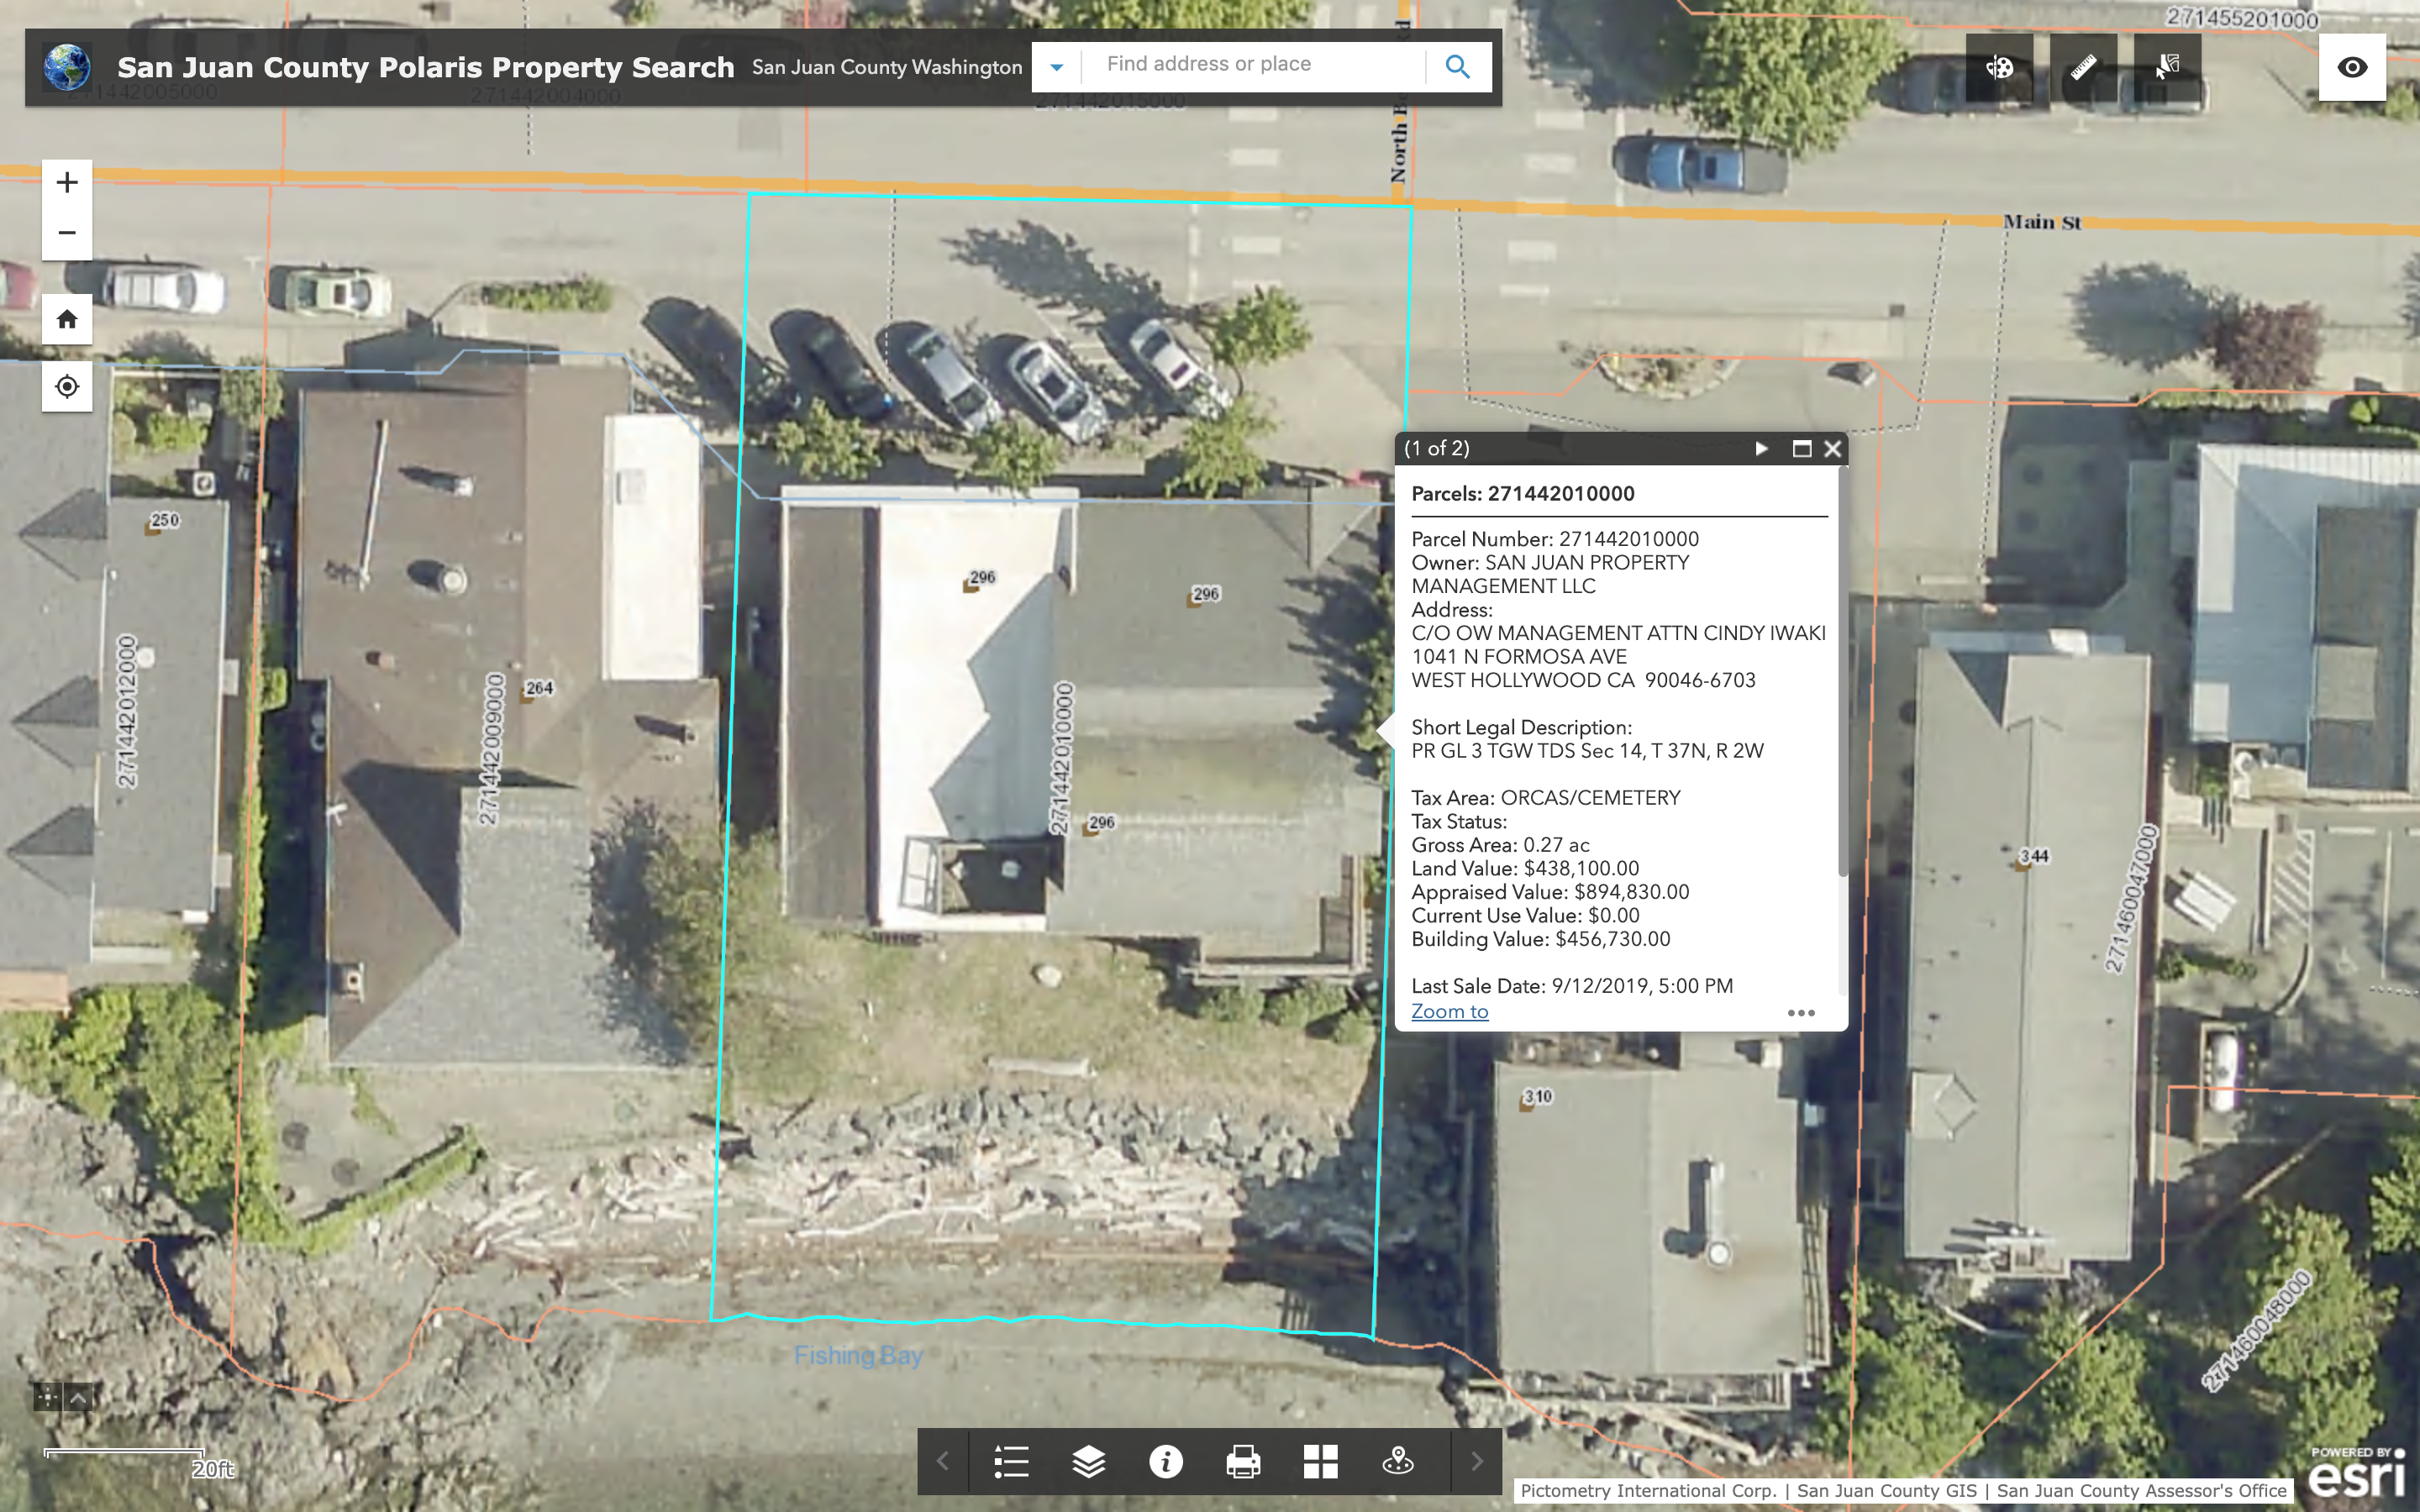 San Juan County/GIS/Polaris
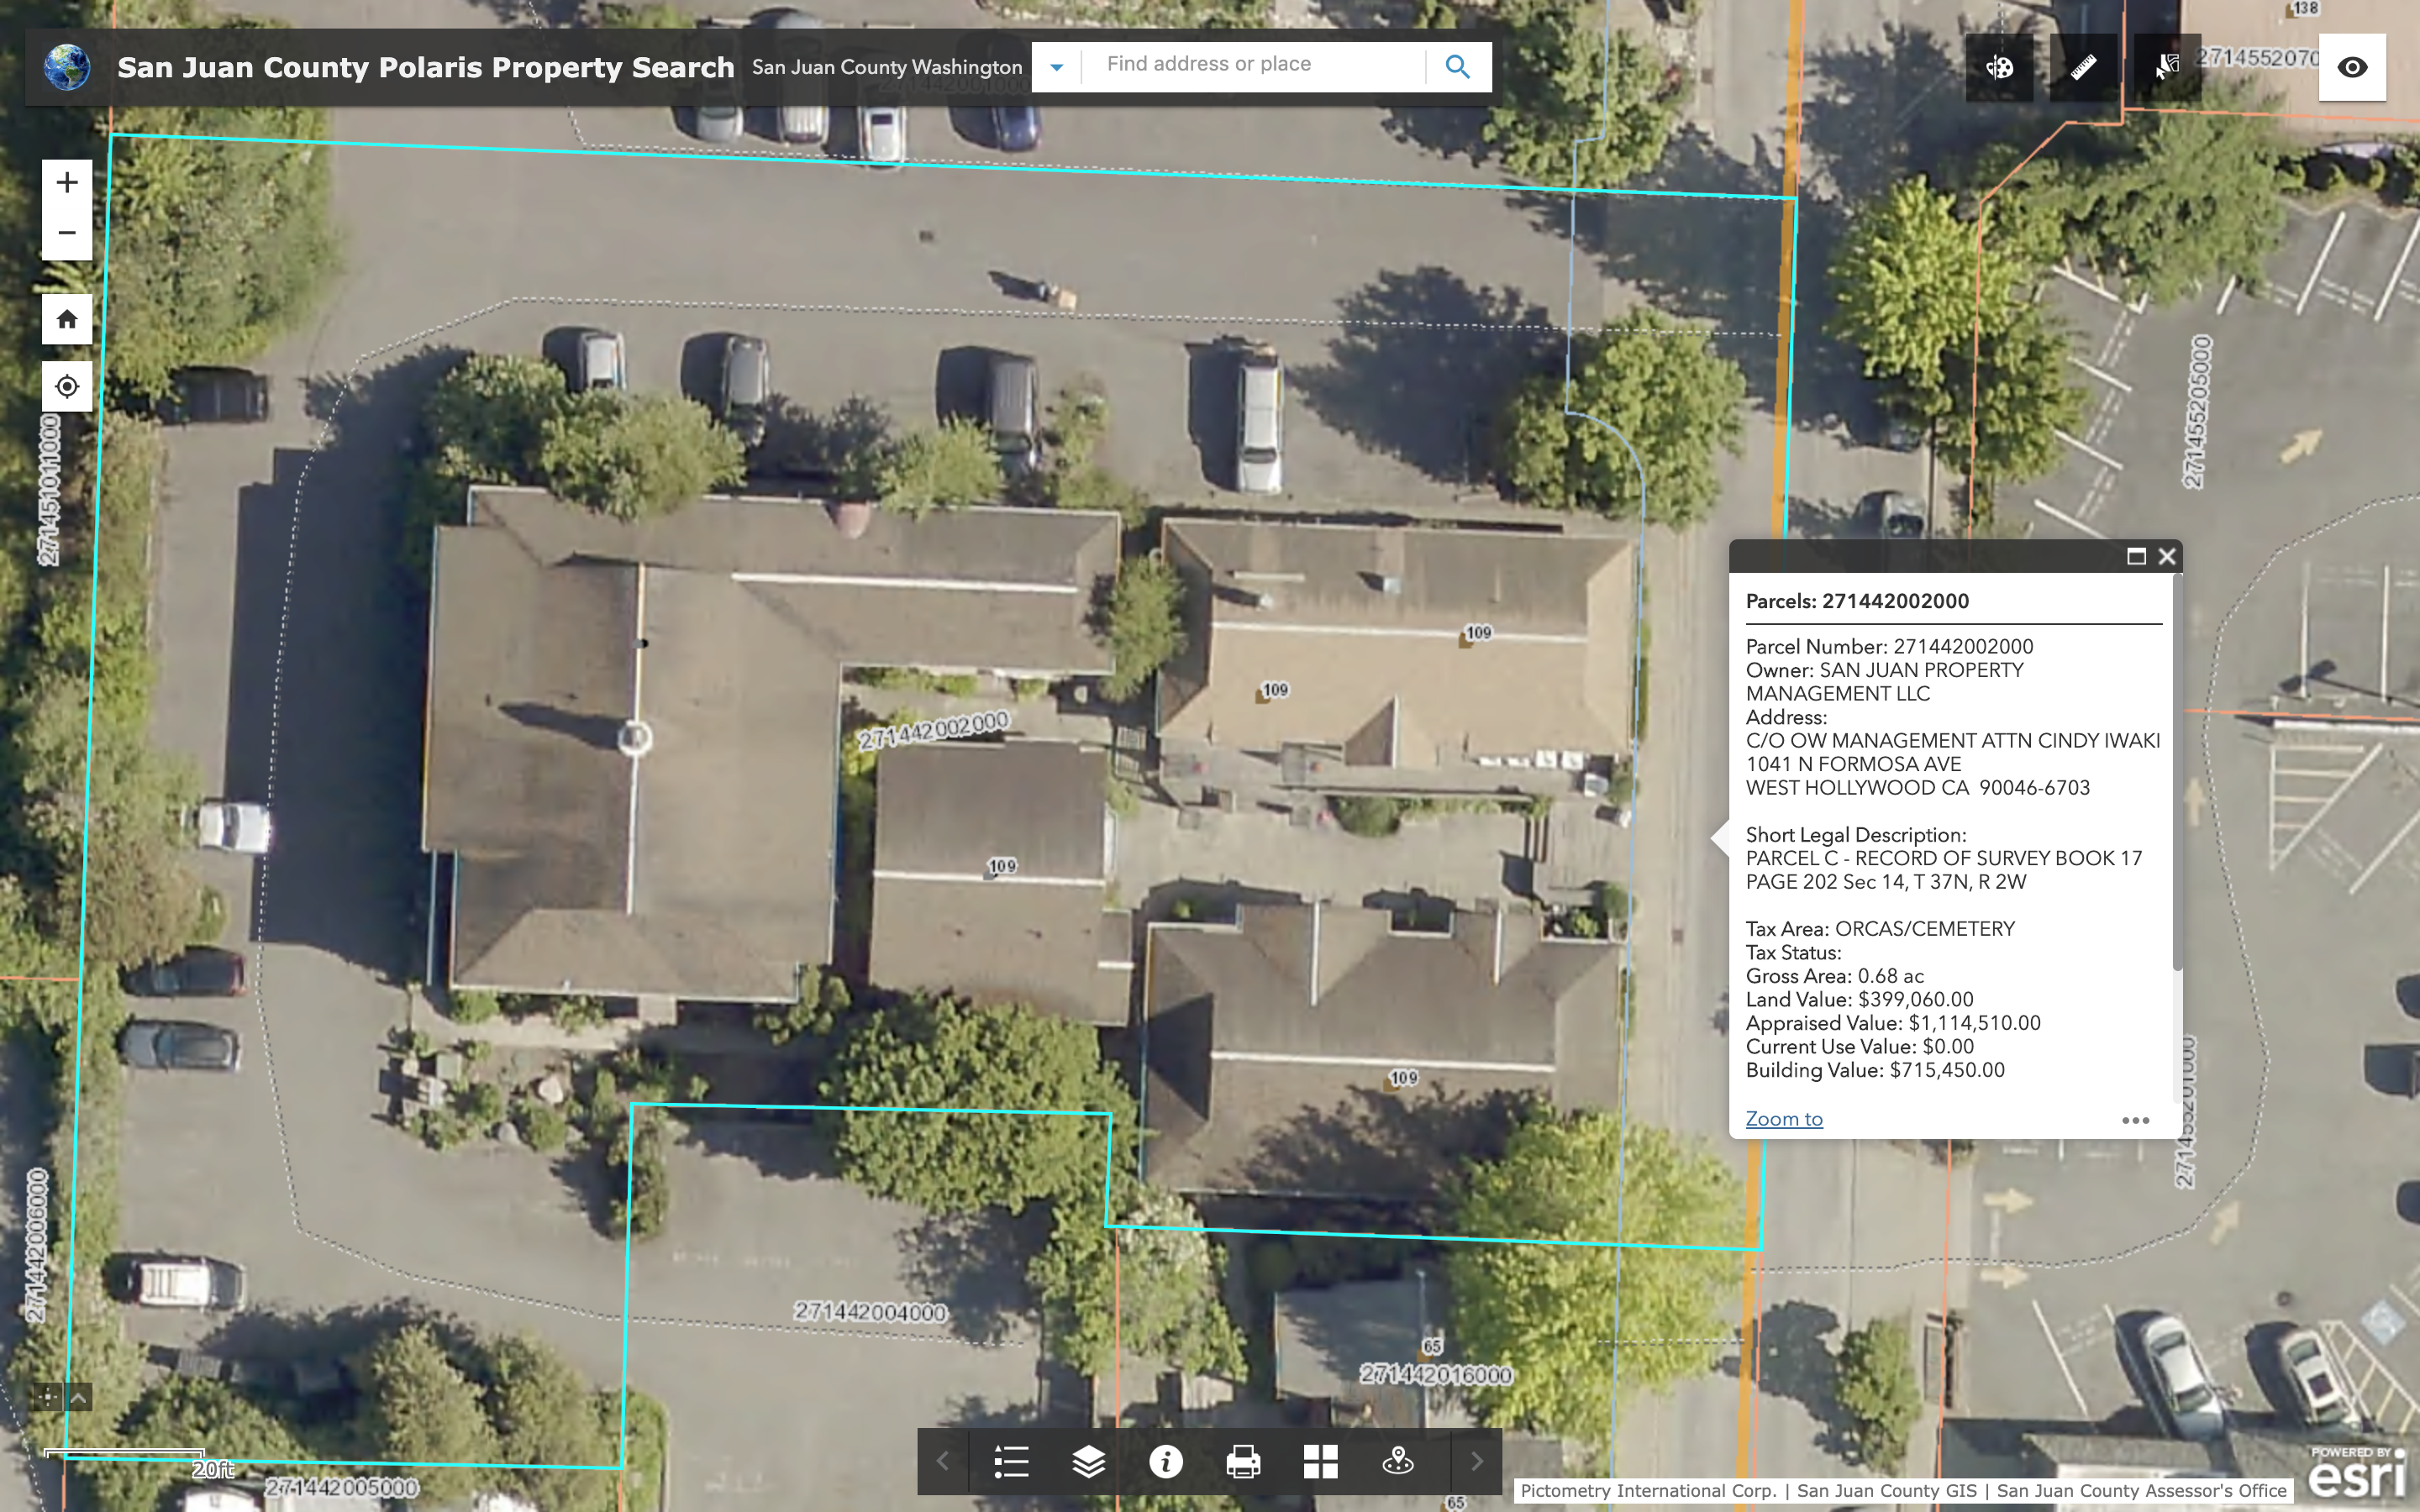 San Juan County/GIS/Polaris
It looks like both the book store and ice cream shop parcels are owned by the same company, San Juan Property Management LLC. A quick business search with the Washington Secretary of State website shows the registered agents and governors for this company.
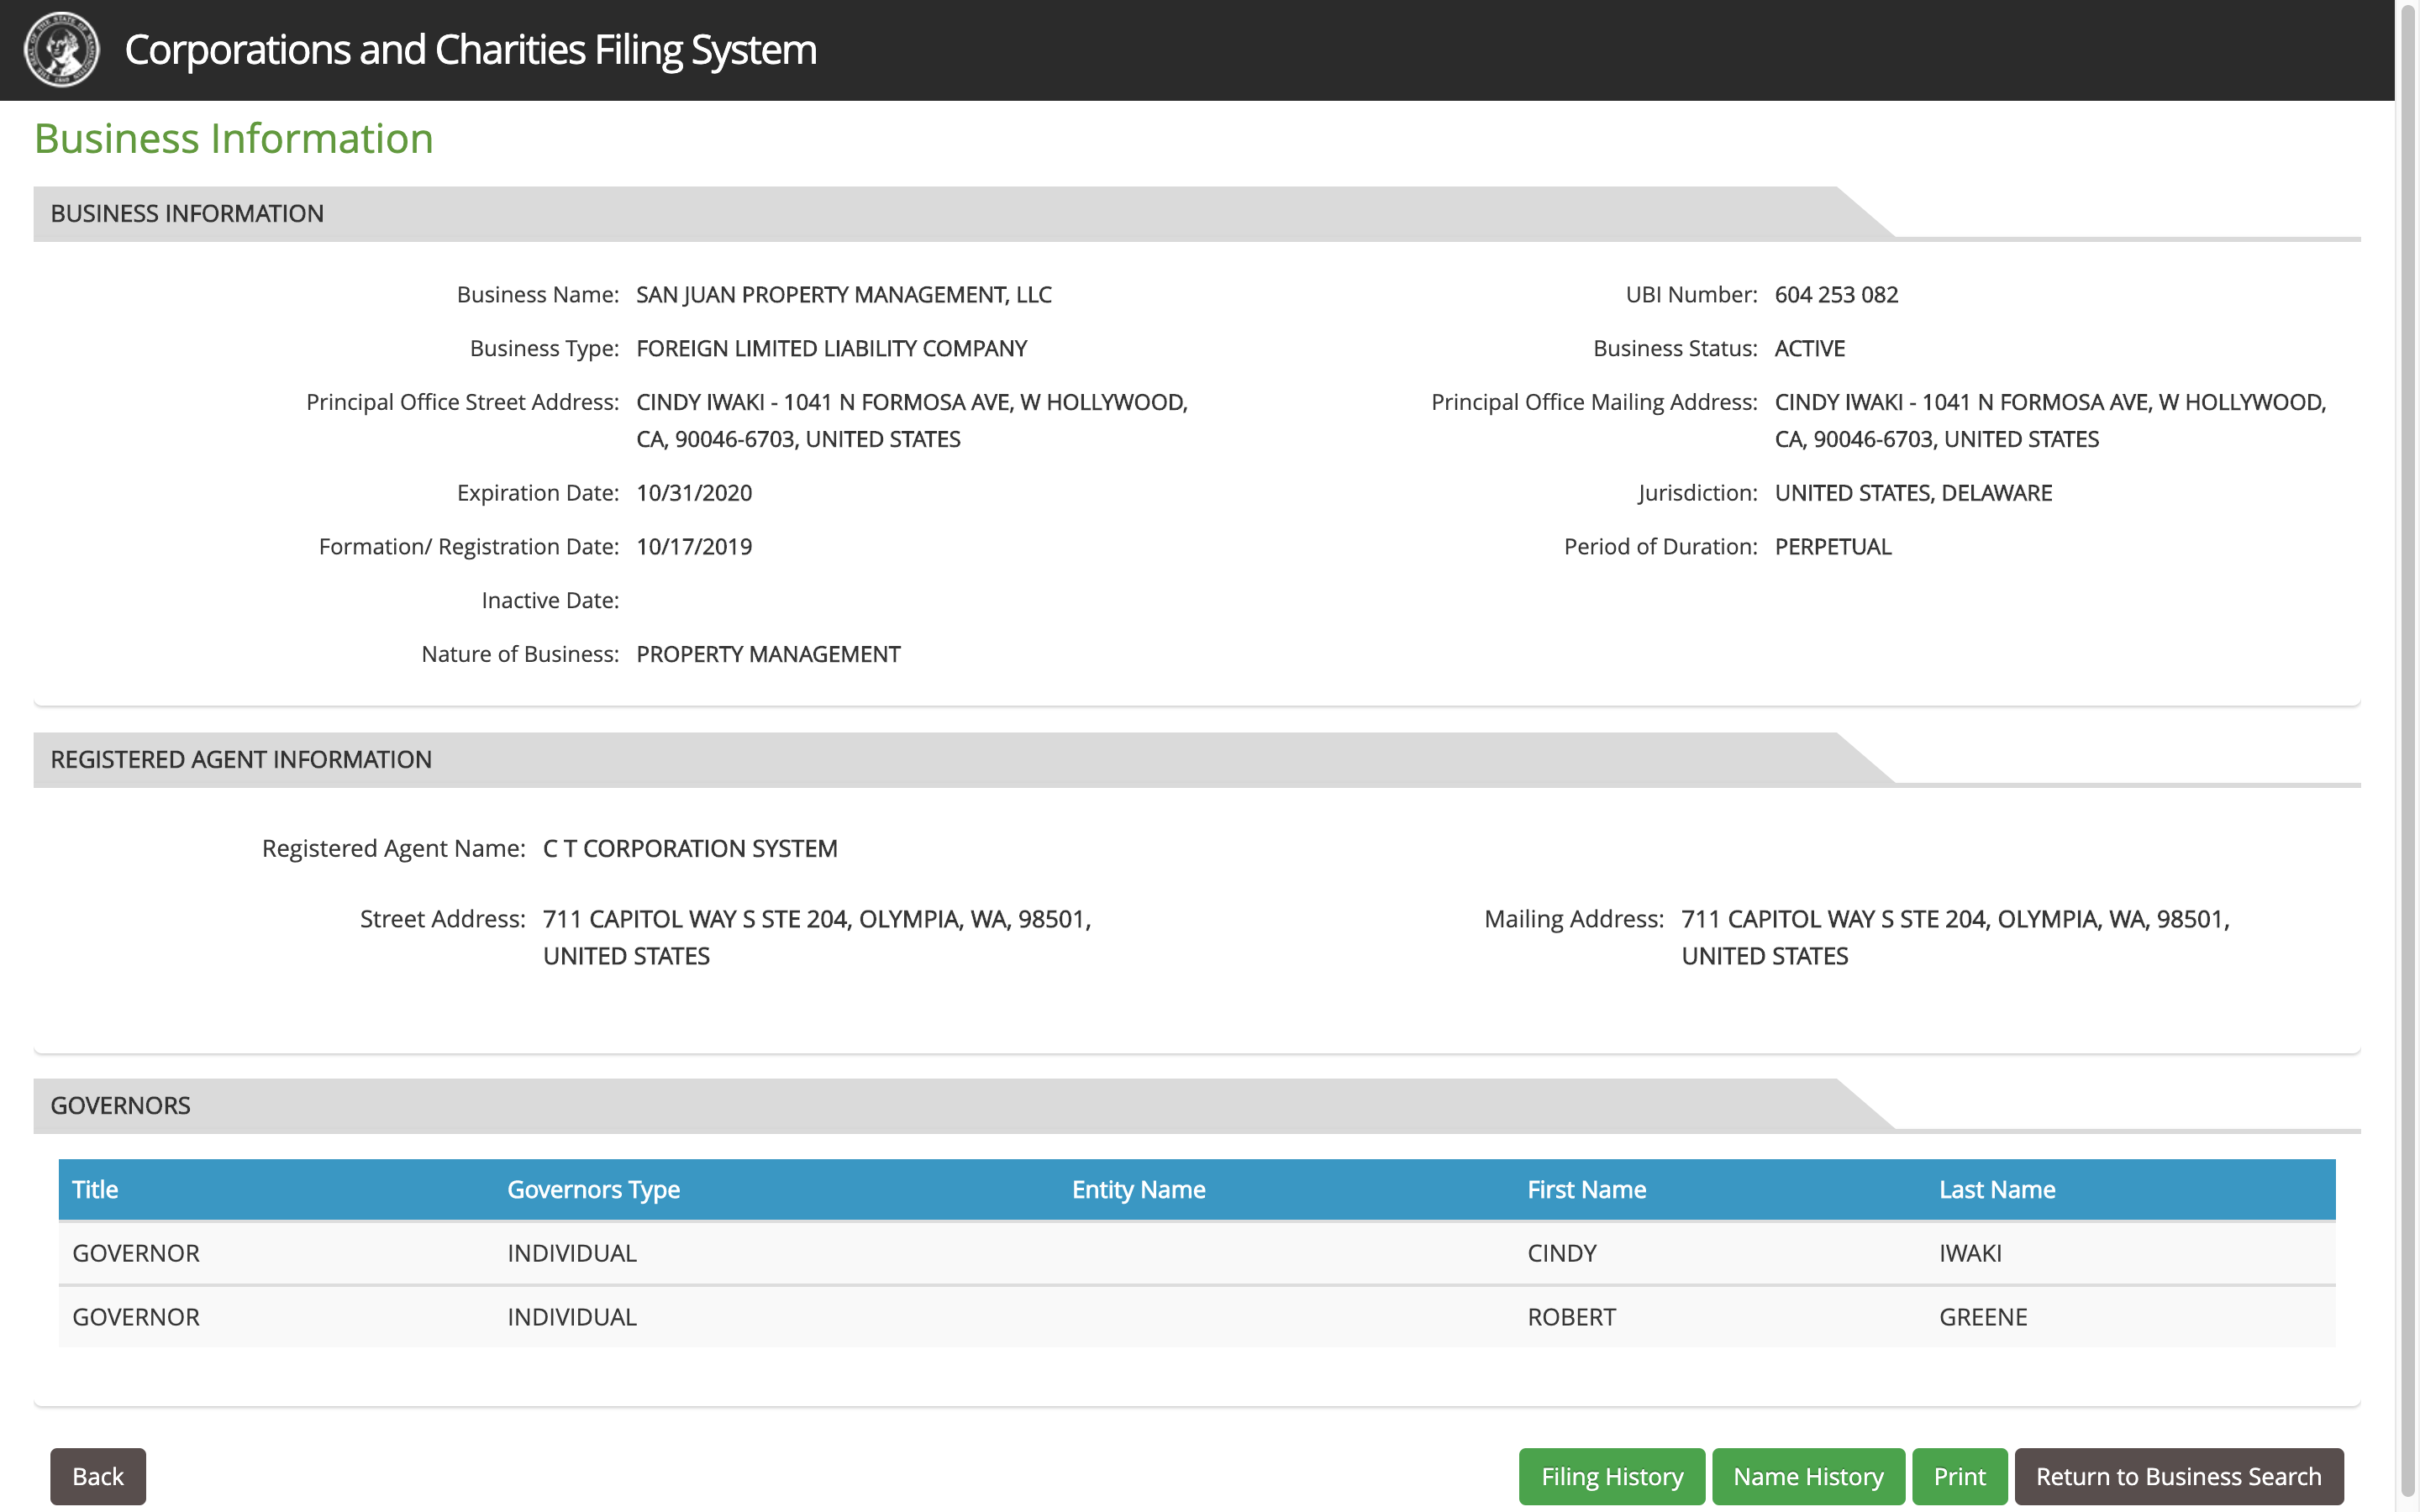 Washington/Secretary of State/Corporations and Charities Filing System
Hmm, Cindy Iwaki, CEO of Harpo Productions LLC (among other companies) and Robert Greene, former trainer and current property manager for Oprah? Yeah, I’d say Oprah owns the book store and the ice cream shop too.
But does she own any other property in the San Juans? The GIS map only lets me search properties by address or maybe parcel ID, not by owner name. Do I have to click on every parcel in the county to check the owner names, waiting for each popup to slowly load?
A More Helpful Map
While this nice parcel web map is steps above what most counties offer, it’s still a bit clunky to use. It’s kind of slow, the map is a little difficult to navigate and the popup information is a bit slow to load. And most importantly for this Oprah property hunt, we can’t easily see any connections between multiple parcels.
So, with that all in mind, let’s make our own parcel map!
Getting Data
First, we need to get our hands on some parcel data. Almost every ArcGIS instance that I’ve come across has a REST interface that feeds the front-end map with all of its data. If you’re lucky, you can use this REST interface to query the data programmatically and save it to disk yourself.
You might have to spend some time looking at network calls in a developer console until you find the right interface, or sometimes you can look over the built-in documentation of the ArcGIS REST services for more help. In this case, we found (and/or tweaked) a network call to query a specific geometry extent (aka a bounding box) of coordinates and return GeoJSON for every parcel in that extent.
curl -v "https://gis.sanjuanco.com/arcgis/rest/services/Polaris/Parcels/MapServer/0/query?outfields=*&f=geoJSON&orderByFields=FID&geometryType=esriGeometryEnvelope&geometry=-122.9031,48.7018,-122.8910,48.7111&inSR=4326&outSR=4326&spatialRel=esriSpatialRelEnvelopeIntersects"
NOTE: I’d recommend piping this curl command to jq if you have it installed, it makes reading JSON much easier!
If you run this curl command, you should get a GeoJSON data object in response that contains a list of features, in this case 337 parcel geometries and their metadata. Each feature should look something like this:
{
      "type": "Feature",
      "id": 9020,
      "geometry": {
        "type": "Polygon",
        "coordinates": [
          [...]
        ]
      },
      "properties": {
        "FID": 9020,
        "OBJECTID_1": 8172,
        "PIN": "271414021000",
        "ALTPin": "271414021",
        "District": "2 - Orcas",
        "Island": "Orcas",
        "Latitude": 48.69881377,
        "Longitude": -122.9053206,
        "PP_1": "271414002",
        "PP_2": "271414002",
        "PP_3": " ",
        "PP_4": " ",
        "Landuse": "VR",
        "Documents": "271414021000",
        "SitusAddr": "...",
        "SitusCity": "Eastsound",
        "SitusState": "WA",
        "SitusZip": "98245",
        "District_N": "21 Orcas - Eastsound",
        "TA_ID": 11417,
        "Owner": "...",
        "Address_1": "...",
        "Address_2": "...",
        "Address_3": " ",
        "City": "OLGA",
        "State": "WA",
        "Zip": "98279-9538",
        "Short_Lega": "NELSON SHORT PLAT - INCORPORATED LOTS 1 & 2    Sec 14, T 37N, R 2W",
        "Legal_Acre": 1.0327,
        "Taxable_Ac": 0.64,
        "Tax_Code": "0374",
        "Tax_Area": "ORCAS/CEMETERY",
        "Land_Value": 234160,
        "Appraised_": 466330,
        "Curruse_Va": 0,
        "Bldg_Value": 232170,
        "Owner_Last": "...",
        "Use_Code": "1108",
        "Tax_Status": " ",
        "Sale_date": null,
        "Sale_Price": 0,
        "Descriptio": "SFR W/ VACA RENT-MAIN HOUSE",
        "Assessor": 11417,
        "Tax_Info": 11417
      }
    }
To get more parcels, you’ll need to write a program that does something like the following:
-
Identify the full extent that covers your area of interest, i.e. the entire county.
-
Break up that bigger extent into a bunch of smaller extents.
- You’ll need to find the right size extents that you can reasonably query without hitting response limits (e.g. max 2000 features), depending on the settings of the ArcGIS REST service.
- To keep it easy, I’d recommend breaking up your extents into something that resembles a slippy tile format, e.g. level 17 tiles.
-
Iteratively query the REST service at each extent, changing the geometry parameter each time with the new extent (aka bounding box) coordinates, following the specified bounding box convention.
- E.g.
geometry=-122.9031,48.7018,-122.8910,48.7111.
- E.g.
-
Save the GeoJSON response either to a big array in program or to separate files on disk, combine when needed (in program or on disk) making sure to deduplicate parcels by a unique ID if available.
- I ended up saving each GeoJSON feature straight to disk using a unique ID as a filename, then overwriting files if needed to handle de-duping.
-
If you’re still hitting response limits for any given extent, you might need to dynamically break up that extent into even smaller extents, e.g. going to higher slippy tile level.
You can use any programming language you feel comfortable with to do this, preferably one that handles HTTP requests and GeoJSON parsing fairly well. Normally I would do this in Python or R, but I chose Golang for this project since I’ve been trying to learn it recently.
If you end up writing a program like this to get parcel data, you should now have one or more GeoJSON files, hopefully full of parcel geometries for the entire county.
I ended up with 17,308 GeoJSON files, one for each parcel. I threw all of these together into a single new-line delimited GeoJSON file (~110MB) since I typically this format for GeoJSON work.
find parcels/ -name '*geojson' | xargs -n 1 -I % bash -c "cat %; echo" > parcels.ndjson
Then I recompiled this new-line delimited file into regular old GeoJSON using the handy ndjson2geojson CLI tool.
ndjson2geojson parcels.ndjson > parcels.geojson
Why did I do all of this? I’m not entirely sure. Mostly because I enjoy learning new geospatial tools and also because I was winging the process as I went along, so I morphed my data structures a couple of different ways. If you plan out your process ahead of time, you can probably skip some of this data wrangling.
Mapbox Studio
Regardless of data format, my next step was to get these parcel geometries into a web map. I’ve been a huge Mapbox fan for a while now so that’s been my go-to for all things web maps. Specifically, I wanted to use Mapbox GL JS to make a nice vector tile web map. So with that in mind, I used Mapbox Studio to create a custom map layer.
Unfortunately, my GeoJSON files were too big to upload directly as datasets into Mapbox Studio. But luckily I could use the amazing tool Tippecanoe to make some vector-based MBTiles with my GeoJSON geometries.
I used the following settings to get a vector layer I was happy with:
tippecanoe -Z10 --drop-densest-as-needed -l parcels -o parcels.mbtiles parcels.geojson
The only thing left to do was upload this MBTile set into Mapbox Studio to create my custom map layer. I didn’t do any custom styling in Mapbox Studio, instead leaving that for later which I’ll do client-side. But this custom map layer should now contain all of the geometries for every parcel in the county, which I can then display in a custom Mapbox GL JS map.
Map Styling
If you haven’t built a custom Mapbox GL JS map before, you can’t go wrong starting with the basics. But for this map, I added a bit more:
- A satellite imagery base layer (e.g. mapbox/satellite-v9)
- Line layers for shorelines, terrain contours and passenger ferry tracks (cause why not), as well as normal and highlighted parcel boundaries
- Fill layers for normal and highlighted parcels
The main feature of this map is highlighting parcels with the same owner. To do this, I needed separate layers for regular and highlighted parcels in order to do custom styling for each layer. I might have been able to do this without having duplicate layers but I’m not sure.
Owner Matching
For highlighting, I made the decision to only highlight the boundary of the parcel that the user clicked, but then highlight the fill of the parcel for all parcels that match on the same attribute ‘Entity’ (indicating the same owner). To do this, I relied on the filter functionality in Mapbox GL JS.
map.on("click", "parcels-fill", function(e) {
	map.setFilter('parcels-fill-highlighted', ['in', 'Entity', feature.properties.Entity]);
}
So if you click anywhere on a feature in the “parcels-fill” layer, any features in the “parcels-fill-highlighted” layer that have the same value for the ‘Entity’ attribute will become visible with the highlighted styling.
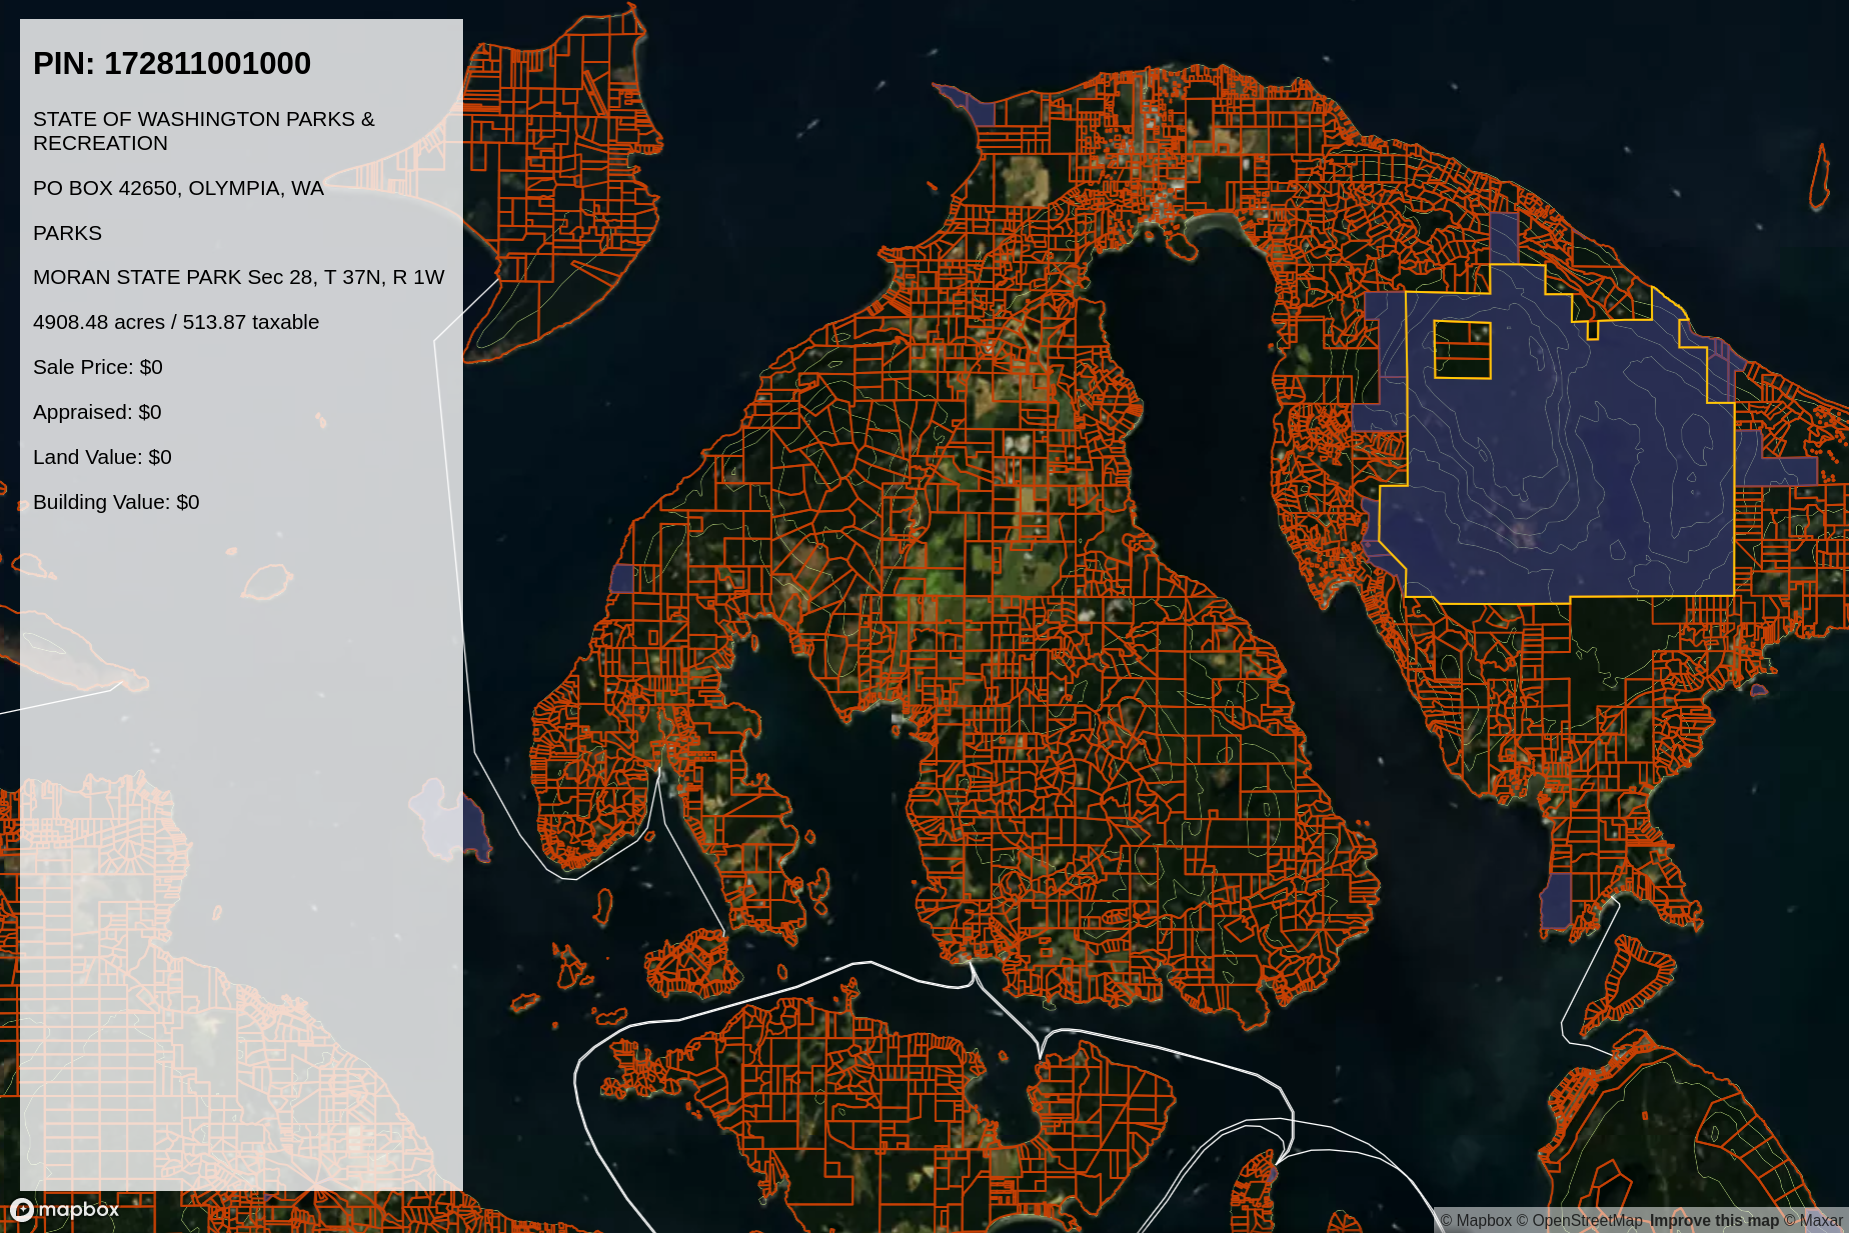
I added a few other things, like turning off the highlights when you click off the parcel and showing some text about the parcel you’ve clicked on (similar to the county’s GIS map), but the highlighting by entity/owner is really the main feature of this map.
Voila! Sorta…
And how about that, it works! Check it out for yourself. When you click on any parcel in the map, it automatically highlights any other parcel with the same owner/entity. As if by magic…
As a demo map to try out this filter/highlighting concept, I think it works pretty well. There’s an obvious issue with doing straight-up 100% string matching between entities/owners, namely that parcel records can be notoriously mislabeled (misspellings, inconsistent address or name formatting, etc). Unfortunately any small text discrepancy in entity/owner names will fail to show the links between multiple parcels. But by and large it works great, and I could add some fuzzy text-matching if I really wanted to be more robust about it.
Another issue would be if multiple parcels are listed as owned by different entities in name that are in some other ways related. Wait, that reminds me…
Oh Yeah, I Forgot, This Is About Oprah!
So we know Oprah owns Madroneagle, the book store and the ice cream shop. Now that we have this nice map, can we find out what else she owns? Well, sorta.
Clicking on the book store first, we see that it’s owned by Canyon View LLC* (c/o Cindy Iwaki). So yeah, that’s Oprah. Next, clicking on the ice cream shop, we see it’s owned by a different company, Yellow Brick Road LLC* (c/o Cindy Iwaki). But yeah, the same Cindy Iwaki, so that’s Oprah too, as we expected. But wait! Three other parcels are highlighted when I click on the ice cream shop, all owned by Yellow Brick Road LLC.
*Note, all of the owner entities of these parcels have since been changed to San Juan Property Management LLC, as shown in the county GIS web map. This custom map is based on stale data from the San Juan County GIS as of a couple of months ago. But it’s a good example for why you might consider automating your data tools to get fresh data!
So it definitely looks like Oprah’s taking the corner here in town, not just buying up large beachfront properties. We could have clicked around randomly on the county parcel map to figure this out, but it’s so much clearer having all of the same-owner parcels highlighted automatically!
Parcel Power
I think the idea of dynamically and visually highlighting contextually-linked properties is a powerful feature for parcel maps. And it was a surprisingly easy to implement in Mapbox GL JS, once I had all of the data. This filter/highlighting trick works really well for this context of finding related parcels, but it’d be fun to explore unique styling methods for other parcel-related investigations.
Even though this is a small demo based around Oprah’s real estate proclivities in the San Juan Islands, access to data of land ownership has a lot of implications in so many areas, everything from real estate speculation to crime to business development to just knowing more about what’s going on in your community. And while there are a lot of important efforts out there ( some free and some commercial) to make this data more useable, don’t be afraid to roll up your sleeves and make something useful for yourself. You might be surprised at the stories you uncover.
- Posted on:
- November 23, 2019
- Length:
- 13 minute read, 2760 words
- See Also: