Earth Observation Imagery References
By Jon Engelsman in References
March 6, 2018
A compilation of links and resources on imagery from the top six US Earth remote observation systems, according to the 2014 National Civil Plan for Earth Observation.
The National Civil Plan for Earth Observation
In 2014, the White House Office of Science and Technology Policy (OSTP) released the 2014 National Civil Plan for Earth Observation. A comprehensive review of government-managed Earth observation systems in the United States (the 1st of its kind), it established “priorities and supporting actions for advancing our civil Earth observations capabilities” to better understand, prioritize and coordinate civil investments in Earth observation.
The National Civil Plan also provided a list of 145 Earth observation systems that were tallied as part of a 2012 Earth Observation Assessment, including rankings for the top 15 systems as shown below.
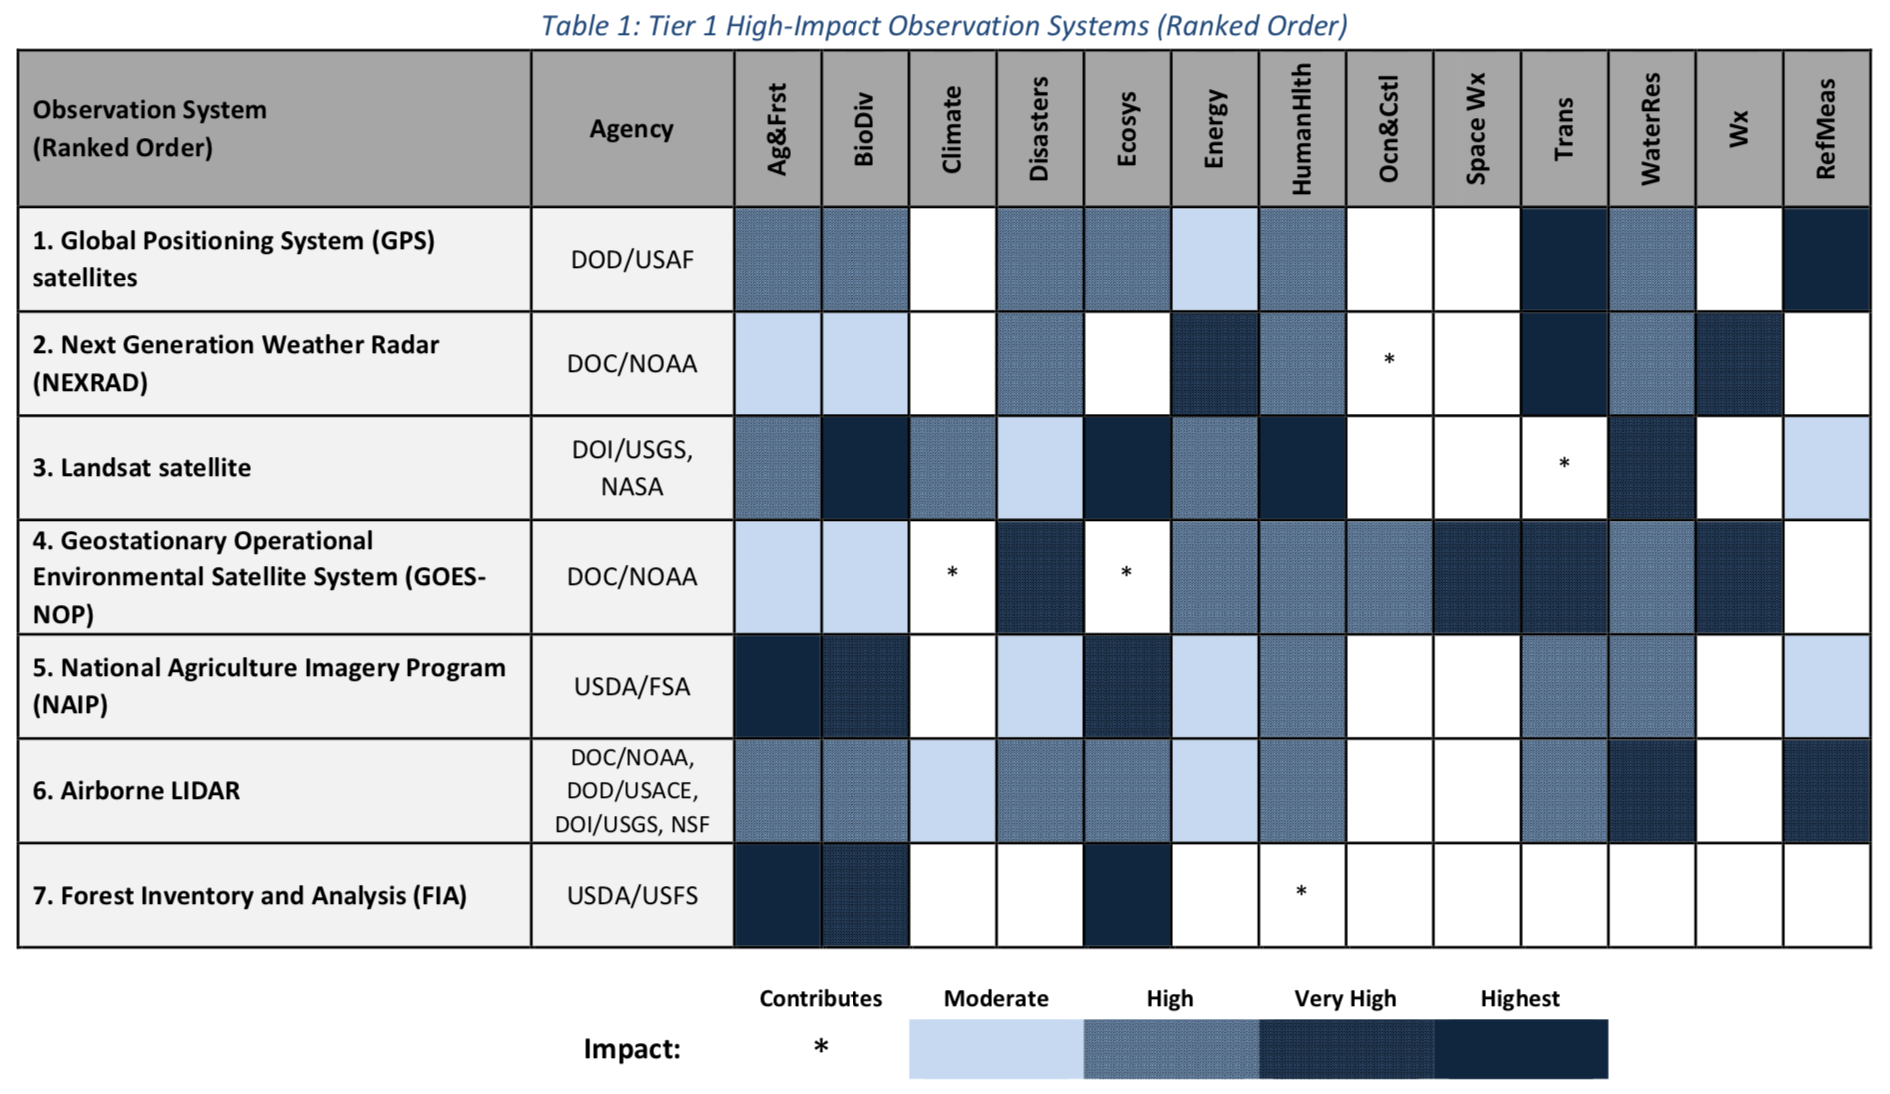
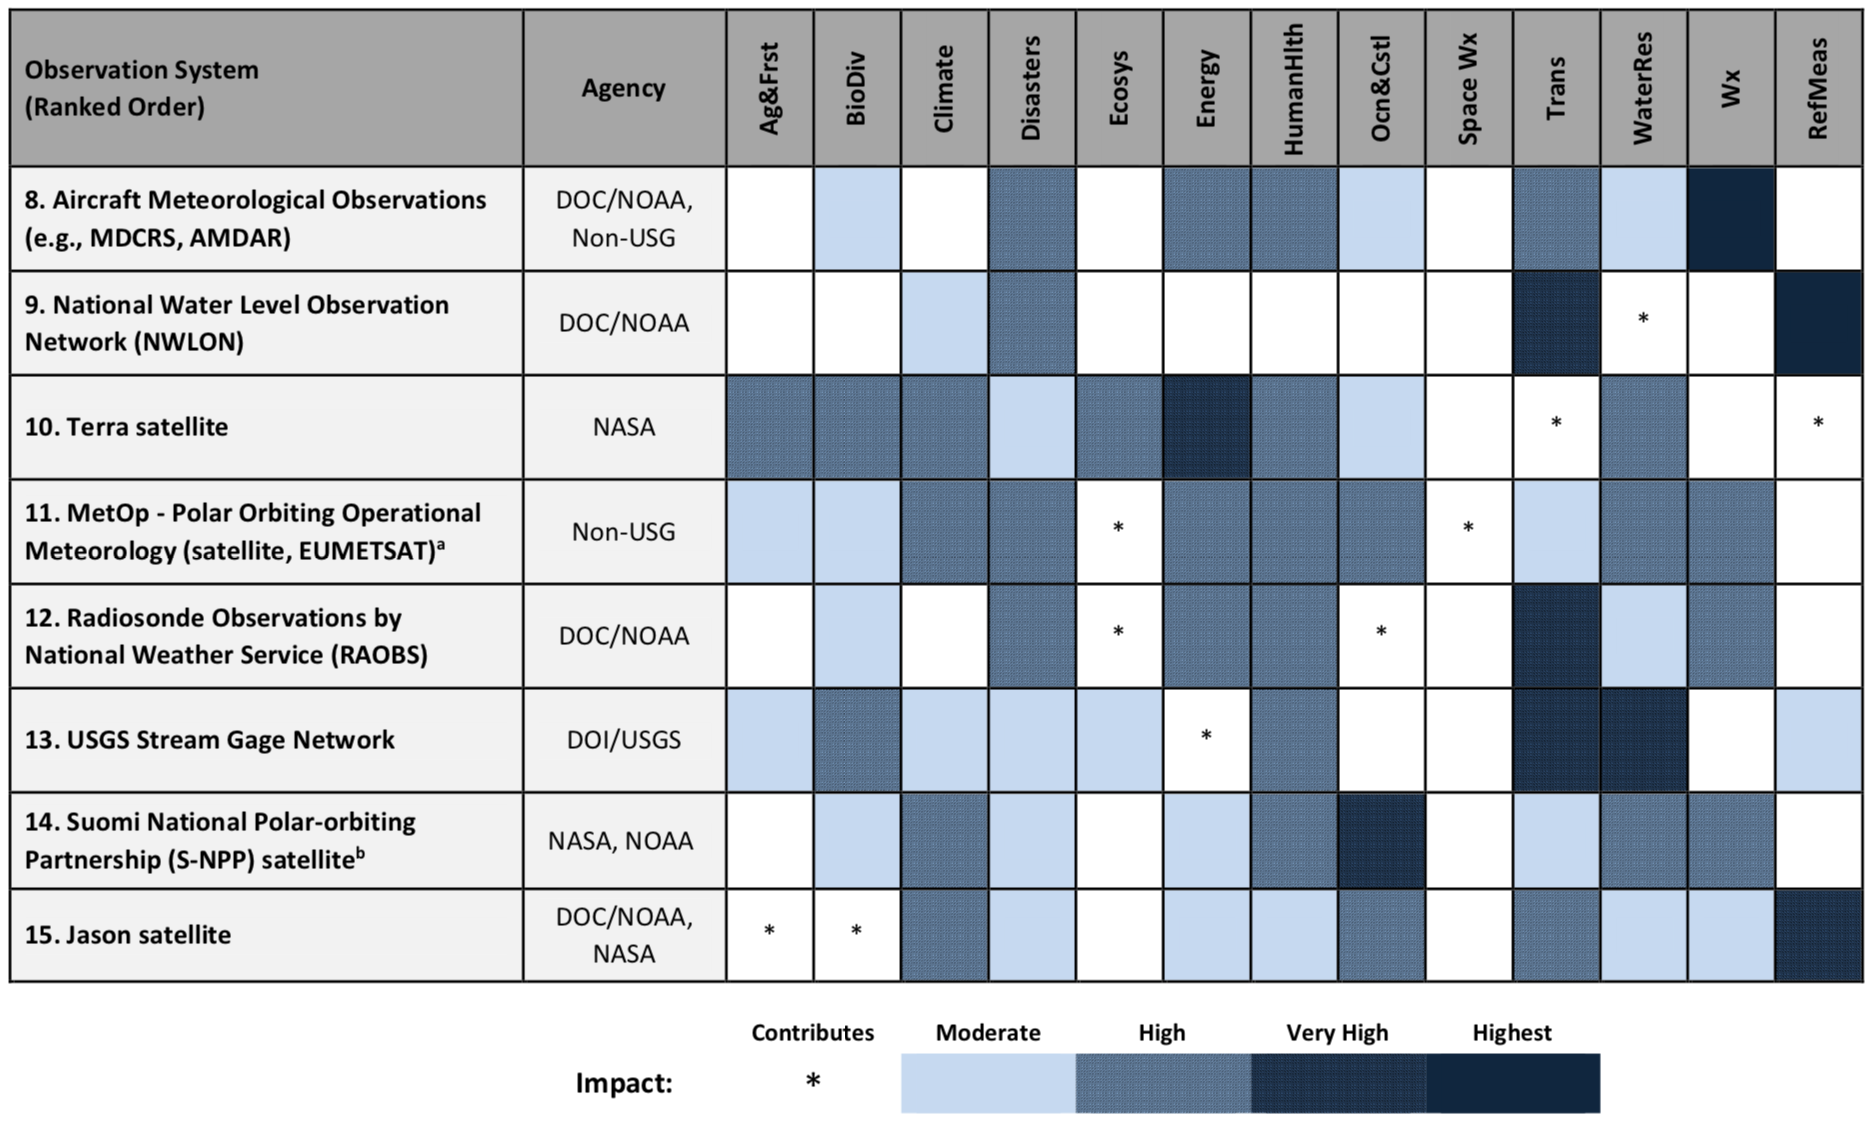
Of these top 15 Earth observation systems, 6 are primarily aerial- or space-based systems that capture multi-spectral imaging data.
- Landsat satellite
- GOES-NOP
- NAIP
- Terra satellite
- MetOp
- Suomi-NPP
For each of these systems, I’ve written up a brief introduction and attempted to compile links to where you can find freely-available, Earth observation imagery data. This reference information will hopefully be useful to many people interested in Earth imagery including GIS specialists, map makers, artists, hobbyists, etc.
Landsat
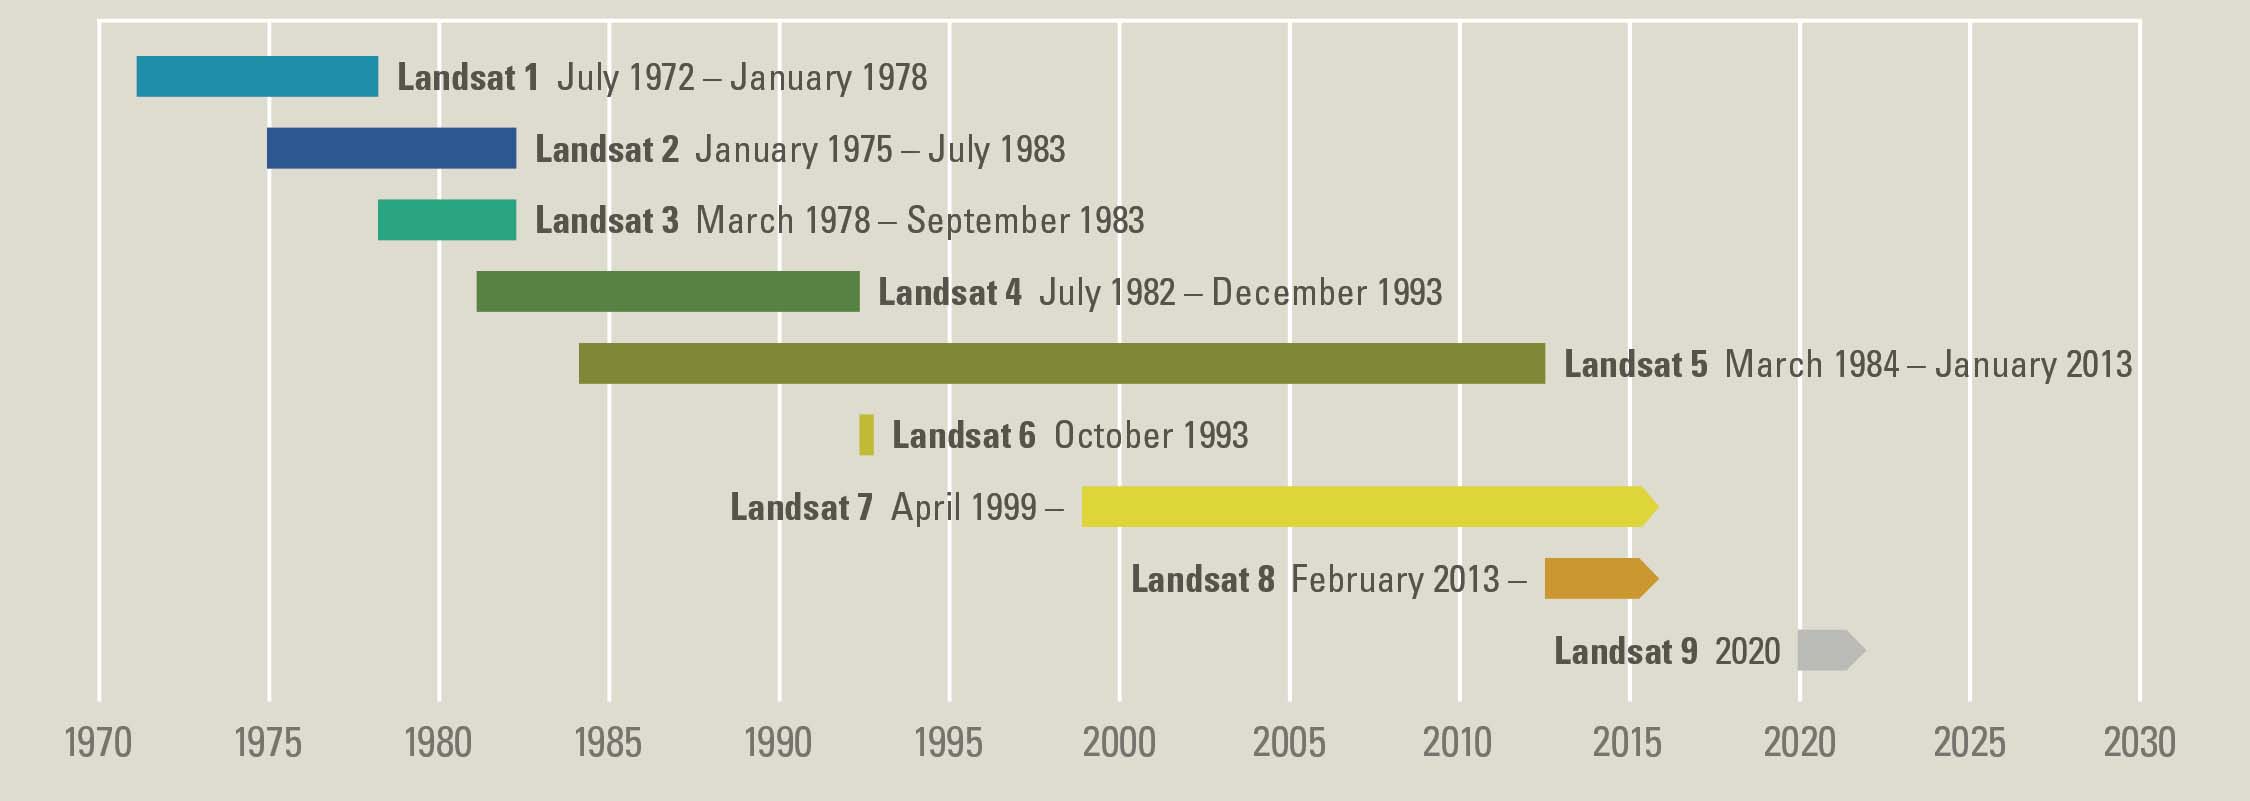
Landsat is a series of Earth observation satellites jointly managed by the USGS and NASA. Continuously running since 1972, Landsat offers the longest continuous space-based record of Earth imagery.
 USGS Landsat
Currently, two Landsat satellites are still active: Landsat 7 launched in 1999 and Landsat 8 launched in 2013.
While Landsat data can be found in almost all commercial satellite imagery mapping services, it is also freely available directly from the USGS, primarily via three different web-based platforms.
Additionally, Landsat 8 data specifically can be found on AWS as an S3 repository ( Landsat on AWS).
Earth observation data from Landsat 7 is provided by the Enhanced Thematic Mapper Plus (ETM+), with seven multi-spectral bands (30 m) and one panchromatic band (15 m).
Earth observation data from Landsat 8 is provided by two primary instruments: the Operational Land Imager (OLI) and Thermal Infrared Sensor (TIS), with eight multi-spectral bands (30 m), one panchromatic band (15 m) and two thermal infrared bands (100 m).
Additional information on the imaging bands of current and previous Landsat missions can be found here.
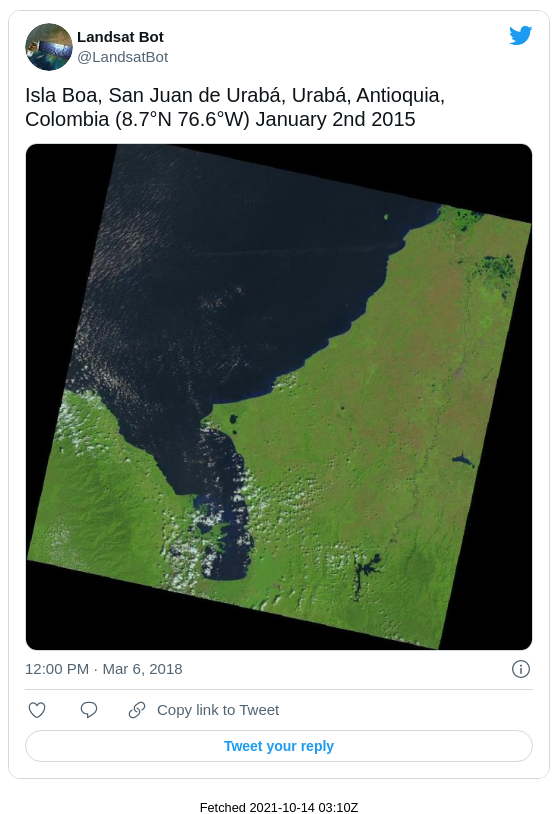
And for a daily slice of Landsat imagery history, the LandsatBot on Twitter posts hourly imagery from Landsat archives.
GOES-NOP
The Geostationary Operational Environmental Satellite (GOES) system is a geostationary satellite program intended to support weather forecasting, severe storm tracking, and meteorology research for the United States. Jointly managed by NOAA’s National Environmental Satellite, Data, and Information Service (NESDIS) and NASA, GOES has been a basic element of U.S. weather monitoring and forecasting since the launch of its first satellite in 1975.
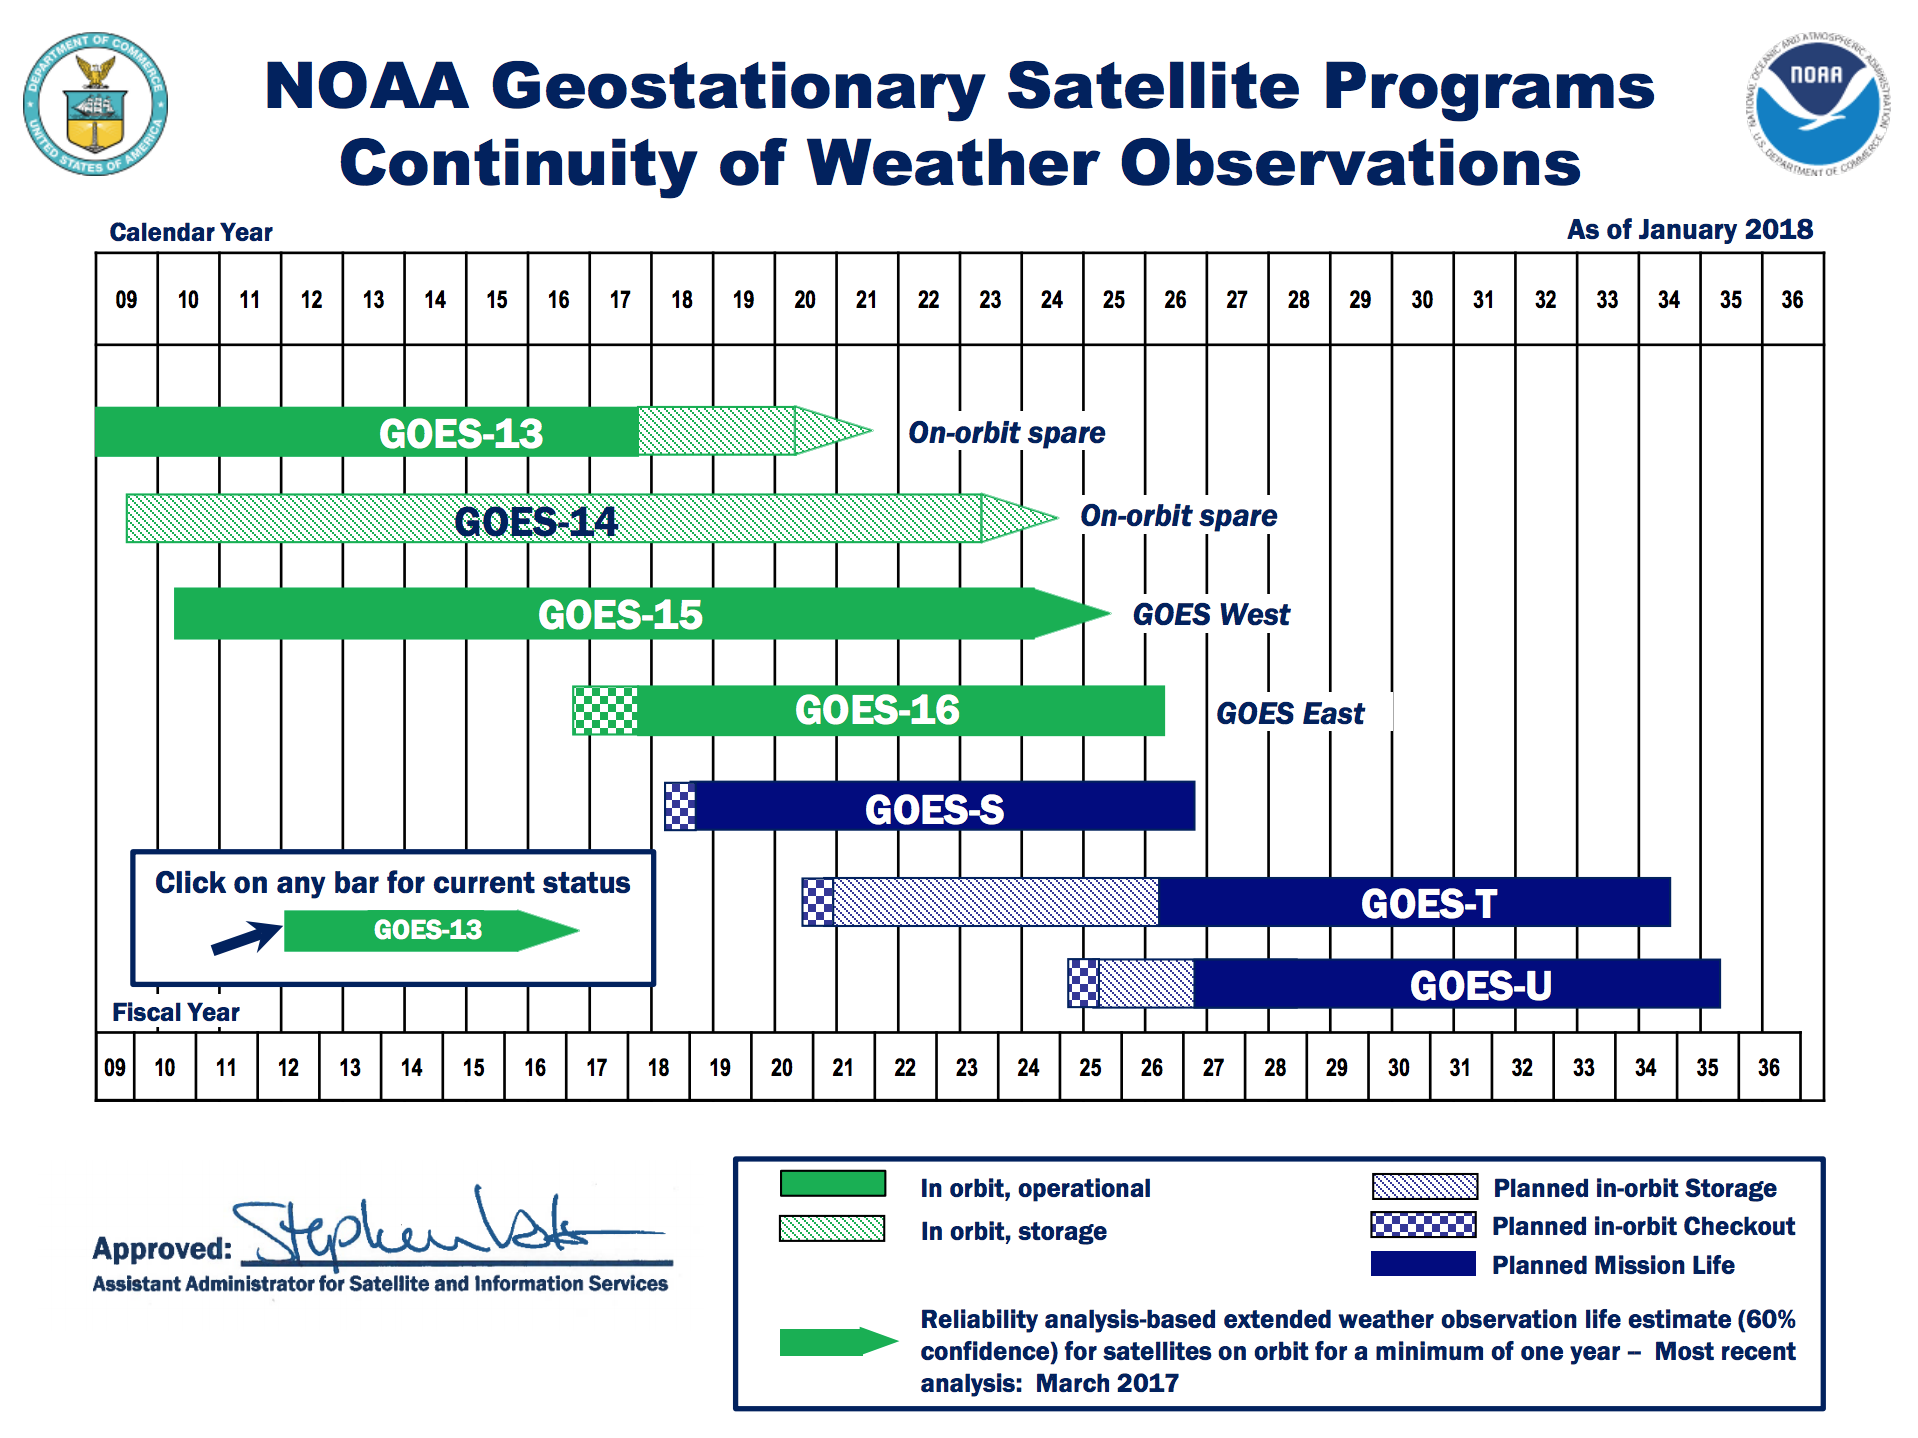
Providing full imagery of the United States and 60% coverage of the Western Hemisphere, the GOES system typically consists of three to four satellites in geostationary orbit. One satellite is designated as the GOES-East platform, another is designated as the GOES-West, and then one to two satellites are typically placed in a storage orbit until needed.
The GOES-NOP series consisted of three satellites that extended the previous 2nd generation GOES spacecraft: GOES-N (later GOES-13), GOES-O (GOES-14) and GOES-P (GOES-15). GOES-N launched in 2006, later taking over as the GOES-East platform in 2010. GOES-O was launched in 2009 and placed in a storage orbit, but has been used intermittently since then. And finally, GOES-P was launched in 2010, taking up operations as GOES-West in 2011.
As of today, the 3rd generation of GOES satellites (referred to as GOES-R series) consists of four satellites: GOES-R, GOES-S, GOES-T and GOES-U. GOES-16 (originally GOES-R) currently operates as GOES-East, launched in 2016 and taking over for GOES-13 in late 2017. GOES-S (soon to be GOES-17) launched in early 2018 and will take over GOES-West operations from GOES-15 in late 2018.
Data from GOES appears to be scattered across various NOAA websites. NOAA’s NESDIS Center for Satellite Applications and Research (STAR) host a number of different webpages that provide high-resolution imagery and animation loops for the GOES-East and GOES-West platforms. Also, websites that host data from GOES often include imagery from other geostationary systems, such as Himawari-8, a satellite operated by the Japanese Meteorological Agency (JMA) or Meteosat, a satellite operated by Europe’s Meteorological Satellite Organization (EUMETSAT).
The following links provide some help on navigating NOAA satellite data and finding GOES data specifically.
NOAA NESDIS also provides the latest imagery from the GOES-16 (GOES-WEST) satellite. CONUS-only and Full Disk imagery is imagery, available in multiple spectral bands.
The latest imagery from GOES-16’s primary imaging instrument, the Advanced Baseline Imager (ABI), was also found on a CDN folder directory, somewhat hidden in the background of the NOAA NESDIS STAR website. This directory includes high-resolution images, up to 10848 x 10848 pixels.
This URL can be modified to access multiple folders of the latest imagery by changing the following parameters:
https://cdn.star.nesdis.noaa.gov/GOES16/ABI/{LOCATION}/{BAND}/
Where {LOCATION} is full disk, CONUS or regional imagery, and can be the following parameters:
FD= Full DiskCONUS= Continental United StatesSECTOR/pnw= Pacific Northwest (Regional)SECTOR/nr= Northern Rockies (Regional)SECTOR/umv= Upper Mississippi Valley (Regional)SECTOR/cgl= Great Lakes (Regional)SECTOR/ne= Northeast (Regional)SECTOR/psw= Pacific Southwest (Regional)SECTOR/sp= Southern Plains (Regional)SECTOR/smw= Southern Mississippi Valley (Regional)SECTOR/se= Southeast (Regional)
And {BAND} is the composite or individual imagery band from the ABI, and can be the following parameters:
GEOCOLOR= GeoColor, 0.65-11.2 m, Vertical Blend of Multiple Channels01= Band 1, 0.47 µm, Blue - Visible02= Band 2, 0.64 µm, Red - Visible03= Band 3, 0.86 µm, Veggie - Near IR04= Band 4, 1.37 µm, Cirrus - Near IR05= Band 5, 1.6 µm, Snow/Ice - Near IR06= Band 6, 2.2 µm, Cloud Particle - Near IR07= Band 7, 3.9 µm, Shortwave Window - IR08= Band 8, 6.2 µm, Upper-Level Water Vapor - IR09= Band 9, 6.9 µm, Mid-Level Water Vapor - IR10= Band 10, 7.3 µm, Lower-Level Water Vapor - IR11= Band 11, 8.4 µm, Cloud Top - IR12= Band 12, 9.6 µm, Ozone - IR13= Band 13, 10.3 µm, Clean Longwave Window - IR14= Band 14, 11.2 µm, Longwave Window - IR15= Band 15, 12.3 µm, Dirty Longwave Window - IR16= Band 16, 13.3 µm, CO2 Longwave - IR
Additionally, NOAA’s NESDIS Regional and Mesoscale Meteorology Branch (RAMMB) at Colorado State University offers some additional GOES imagery, including the Satellite Loop Interactive Data Explorer in Real-time (SLIDER).
NAIP
The National Agriculture Imagery Program (NAIP) is an annual aerial imagery campaign managed by the US Department of Agriculture (USDA) through its Farm Service Agency (FSA)’s Aerial Photography Field Office (APFO). Started in 2003, NAIP is a yearly effort to image the majority of the continental United States during peak agriculture growth season.
NAIP imagery is publicly available, often used in commercial mapping services (e.g. Google Maps, Mapbox, Bing, etc) for United States land imagery, similar to Landsat imagery.
It is publicly available by the US government in two primary formats:
- ArcGIS-based REST service provided by the APFO
- USDA National Resources Conservation Service (NRCS) Geospatial Data Gateway (GDG).
Additionally, NAIP imagery for 2012-2015 is available on AWS as NAIP on AWS.
Terra satellite
Terra is a multi-national scientific research satellite, launched by NASA in 1999. Along with its twin satellite Aqua (launched in 2002), Terra is a flagship of NASA’s Earth Observing System (EOS), a program coordinating the long-term global observations of the Earth’s surface, biosphere and atmosphere.
 NASA EOS
The Terra satellite scientific payload consists of five instruments:
- Advanced Spaceborne Thermal Emission and Reflection Radiometer (ASTER)
- Clouds and the Earth’s Radiant Energy System (CERES)
- Multi-angle Imaging SpectroRadiometer (MISR)
- Moderate-resolution Imaging Spectroradiometer (MODIS)
- MOPITT (Measurements of Pollution in the Troposphere)
ASTER and MODIS are the primary multi-spectral imaging instruments on board both Terra and Aqua, and details on their data products can be found at the following locations:
MODIS imagery is also available on AWS as MODIS on AWS.
MetOp
The Meteorological Operation (MetOp) satellite program is an operational meteorological observation joint effort, primarily by the European Space Agency (ESA) and EUTELMAT with additional support from Centre national d’études spatiales (CNES) and NOAA. The MetOp program will eventually consist of three satellites: MetOp-A launched in 2006, MetOp-B launched in 2012, and MetOp-C is expected to launch in 2018.
The MetOp satellites carry a total of 10 scientific instruments, providing data from a variety of atmospheric and oceanographic measurements.
Data from MetOp satellites is available via JPL’s Physical Oceanography Distributed Active Archive Center (PODAAC):
Suomi-NPP
The Suomi National Polar-orbiting Partnership (NPP) satellite is the first of NOAA’s next generation Joint Polar Satellite System (JPSS)
Suomi NPP has four instruments providing imaging and scientific measurements:
- Clouds and the Earth’s Radiant Energy System (CERES)
- Cross-track Infrared Sounder (CRIS)
- Advanced Technology Microwave Sounder (ATMS)
- Ozone Mapping and Profiler Suite (OMPS)
- Visible Infrared Imaging Radiometer Suite (VIIRS)
The primary imaging product from Suomi NPP is provided by the VIIRS instrument, and imagery and raw data can be found at a number of NASA, NOAA and other related agency/academic organizations.
The VIIRS instrument also has a specific data product called the Day/Night Band (DNB) which has created base layer imaging for the Earth at night, showing city lights and other nighttime features. This imagery is available in multiple formats, but is provided by NASA as their Black Marble product.
Consolidated Data Locations
Raw satellite and aerial imagery can often be difficult to track down across all of the interagency government websites. Available in many formats, from raw data to processed color imagery, it’s no small feat to consolidate all of this data coming from so many different government organizations.
There are some efforts in NASA and other agencies to consolidate this information in one, easy-to-access endpoint online. One example is NASA’s EarthData Global Imagery Browse Services (GIBS). Another good place to check out is NASA’s Visible Earth page, which includes some great imagery sets like the Night Lights 2012 map and the famous Blue Marble image.
Non-US Programs
The European Commission (EC) and European Space Agency (ESA)’s flagship satellite imaging platform known as Copernicus is currently operating six Earth observations satellites under the Sentinel program.
Two of these satellites, Sentinel-2A and Sentinel-2B, provide multi-spectral imagery data which are freely available online.
- Posted on:
- March 6, 2018
- Length:
- 9 minute read, 1851 words
- Categories:
- References
- Tags:
- remote sensing government