Contour Art of Mars Topography
By Jon Engelsman in Tutorials
February 26, 2018
Martian-inspired topographic contour lines in QGIS using literary color palettes.
Plotter Twitter
I’ve recently been inspired by the plotter art community on Twitter ( #plottertwitter). Michael Fogleman ( @foglebird) in particular has been doing some beautiful work with topographic contour lines from various parts of the US.
 Michael Fogleman
He’s also started making similar style art using topographic data from Mars!
The data comes from a pair of stereo cameras on a satellite orbiting Mars. It takes snapshot swaths as it orbits, so you end up with stuff that looks like this. pic.twitter.com/BfyieBbs4d
— Michael Fogleman (@FogleBird) February 26, 2018
Mars Topographic Data
I wanted to try making some contour art myself, and I liked the idea of using Mars data. Luckily (and amazingly), there is a lot of topographic data out in the public domain, both for Earth but amazingly for other planets too!
The High Resolution Imaging Science Experiment (HiRISE) onboard the Mars Reconnaissance Orbiter (MRO) has been taking high-resolution images of Mars since 2006. These images, taken in stereoscopic pairs, are combined to create elevation data sets, a method known as photogrammetry.
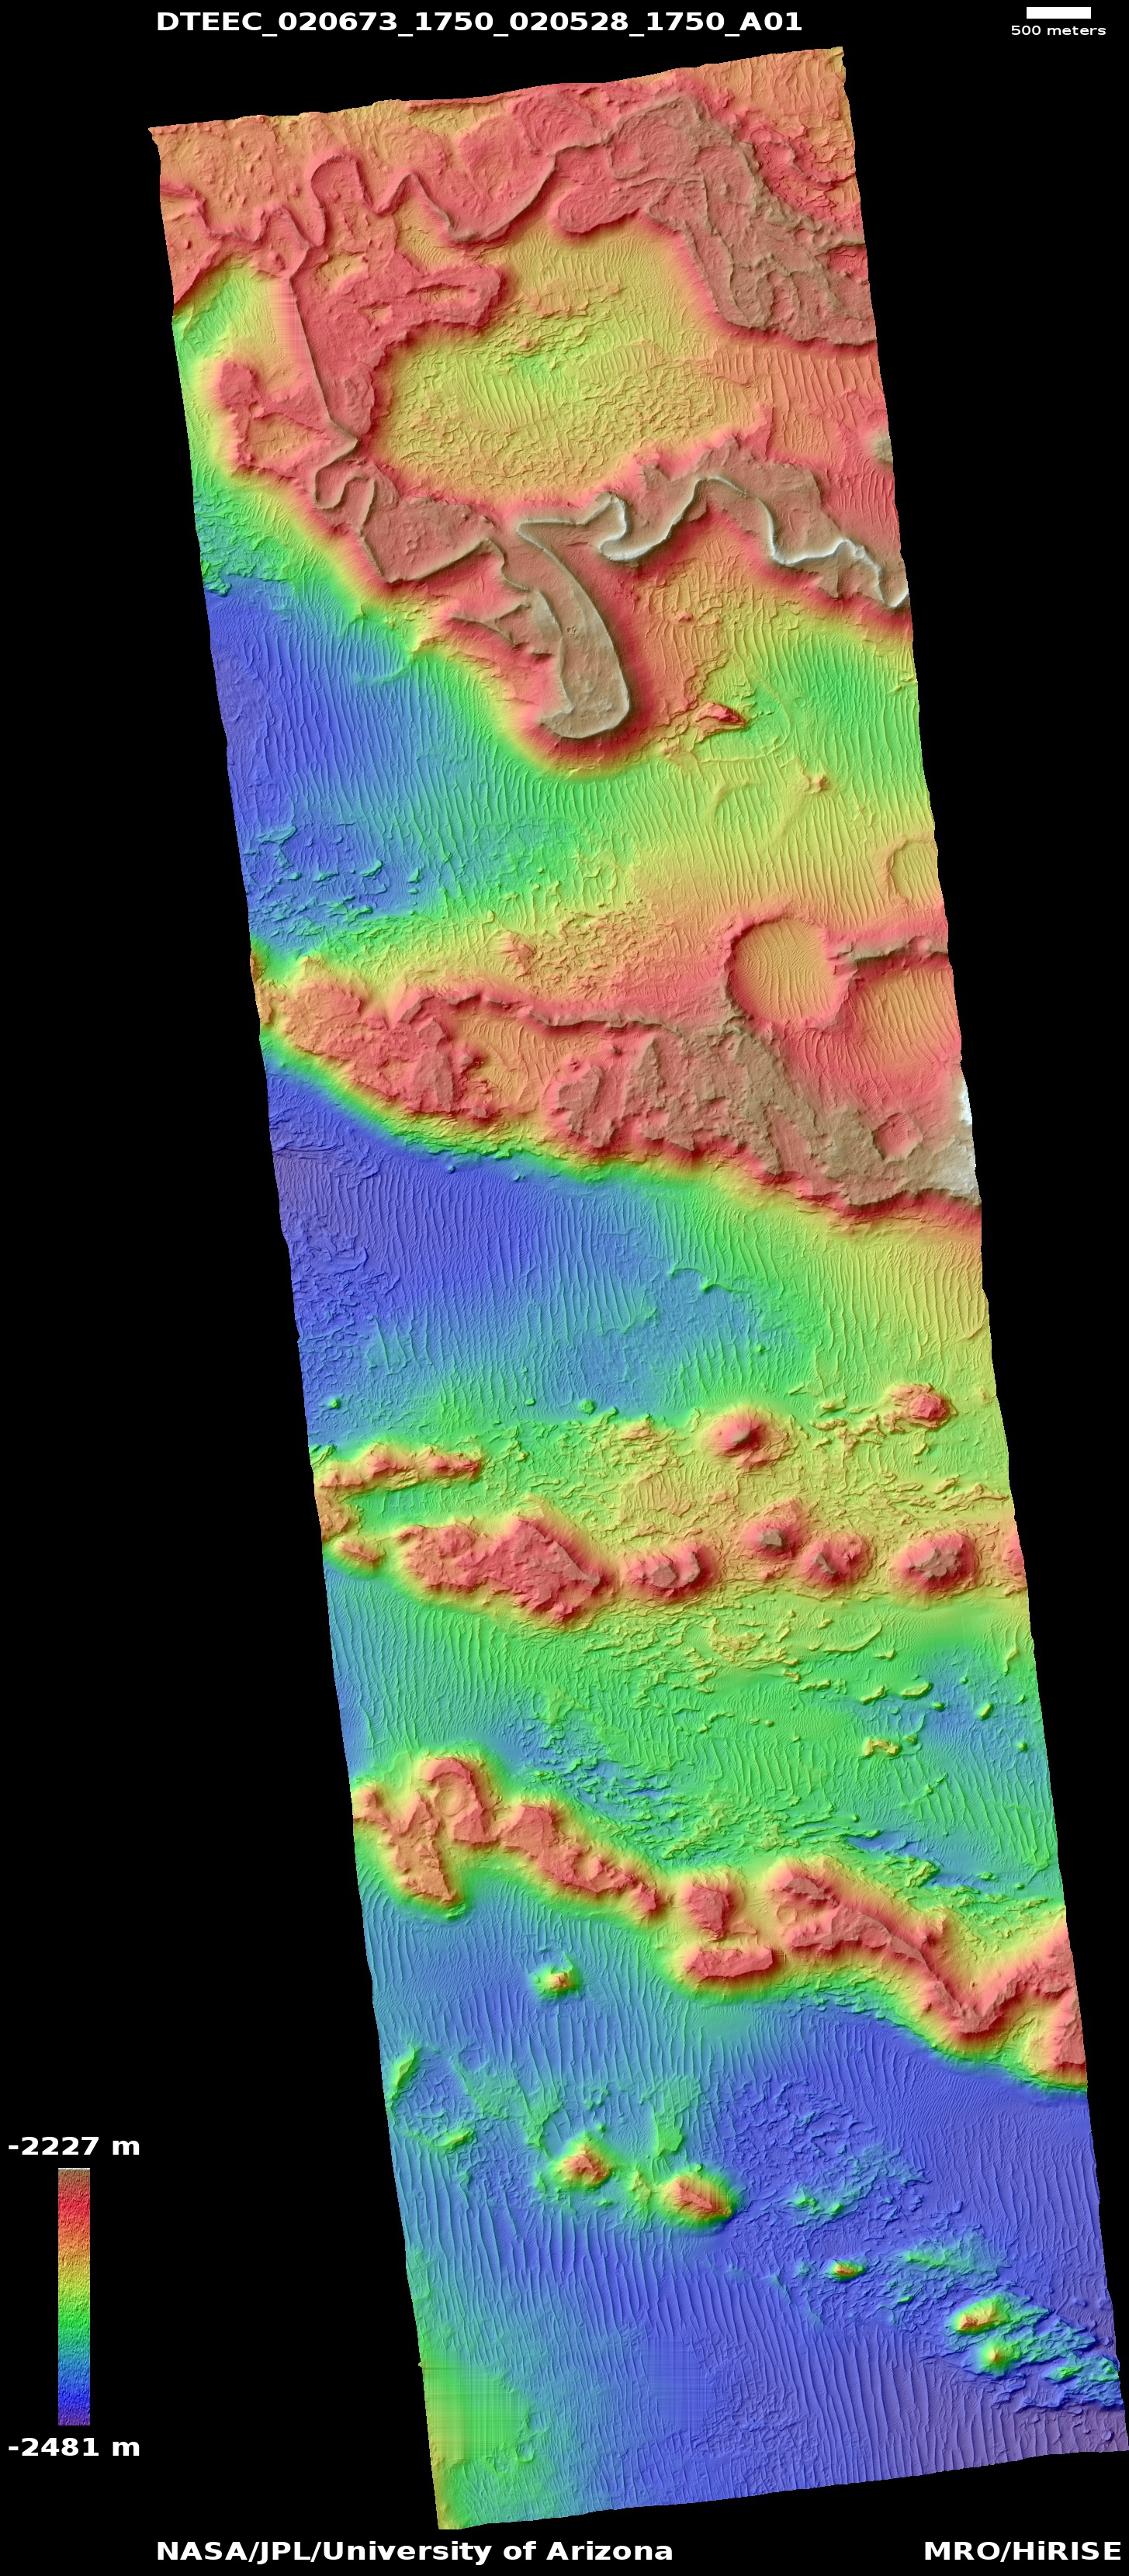
A lot of this data is available via the University of Arizona in a HiRISE DTM gallery. Browsing this gallery, I found the image ‘ Martian Meanders and Scroll-Bars’.
 The University of Arizona/Lunar & Planetary Laboratory/HiRISE
The elevation data in this particular image has been coloured using the Spectral color palette, a very common colour scheme in scientific plots. But I want to add custom contour lines and tweak the colour scheme a bit to make it more thematic, so I have a bit of work to do.
Using QGIS To Make Contour Art
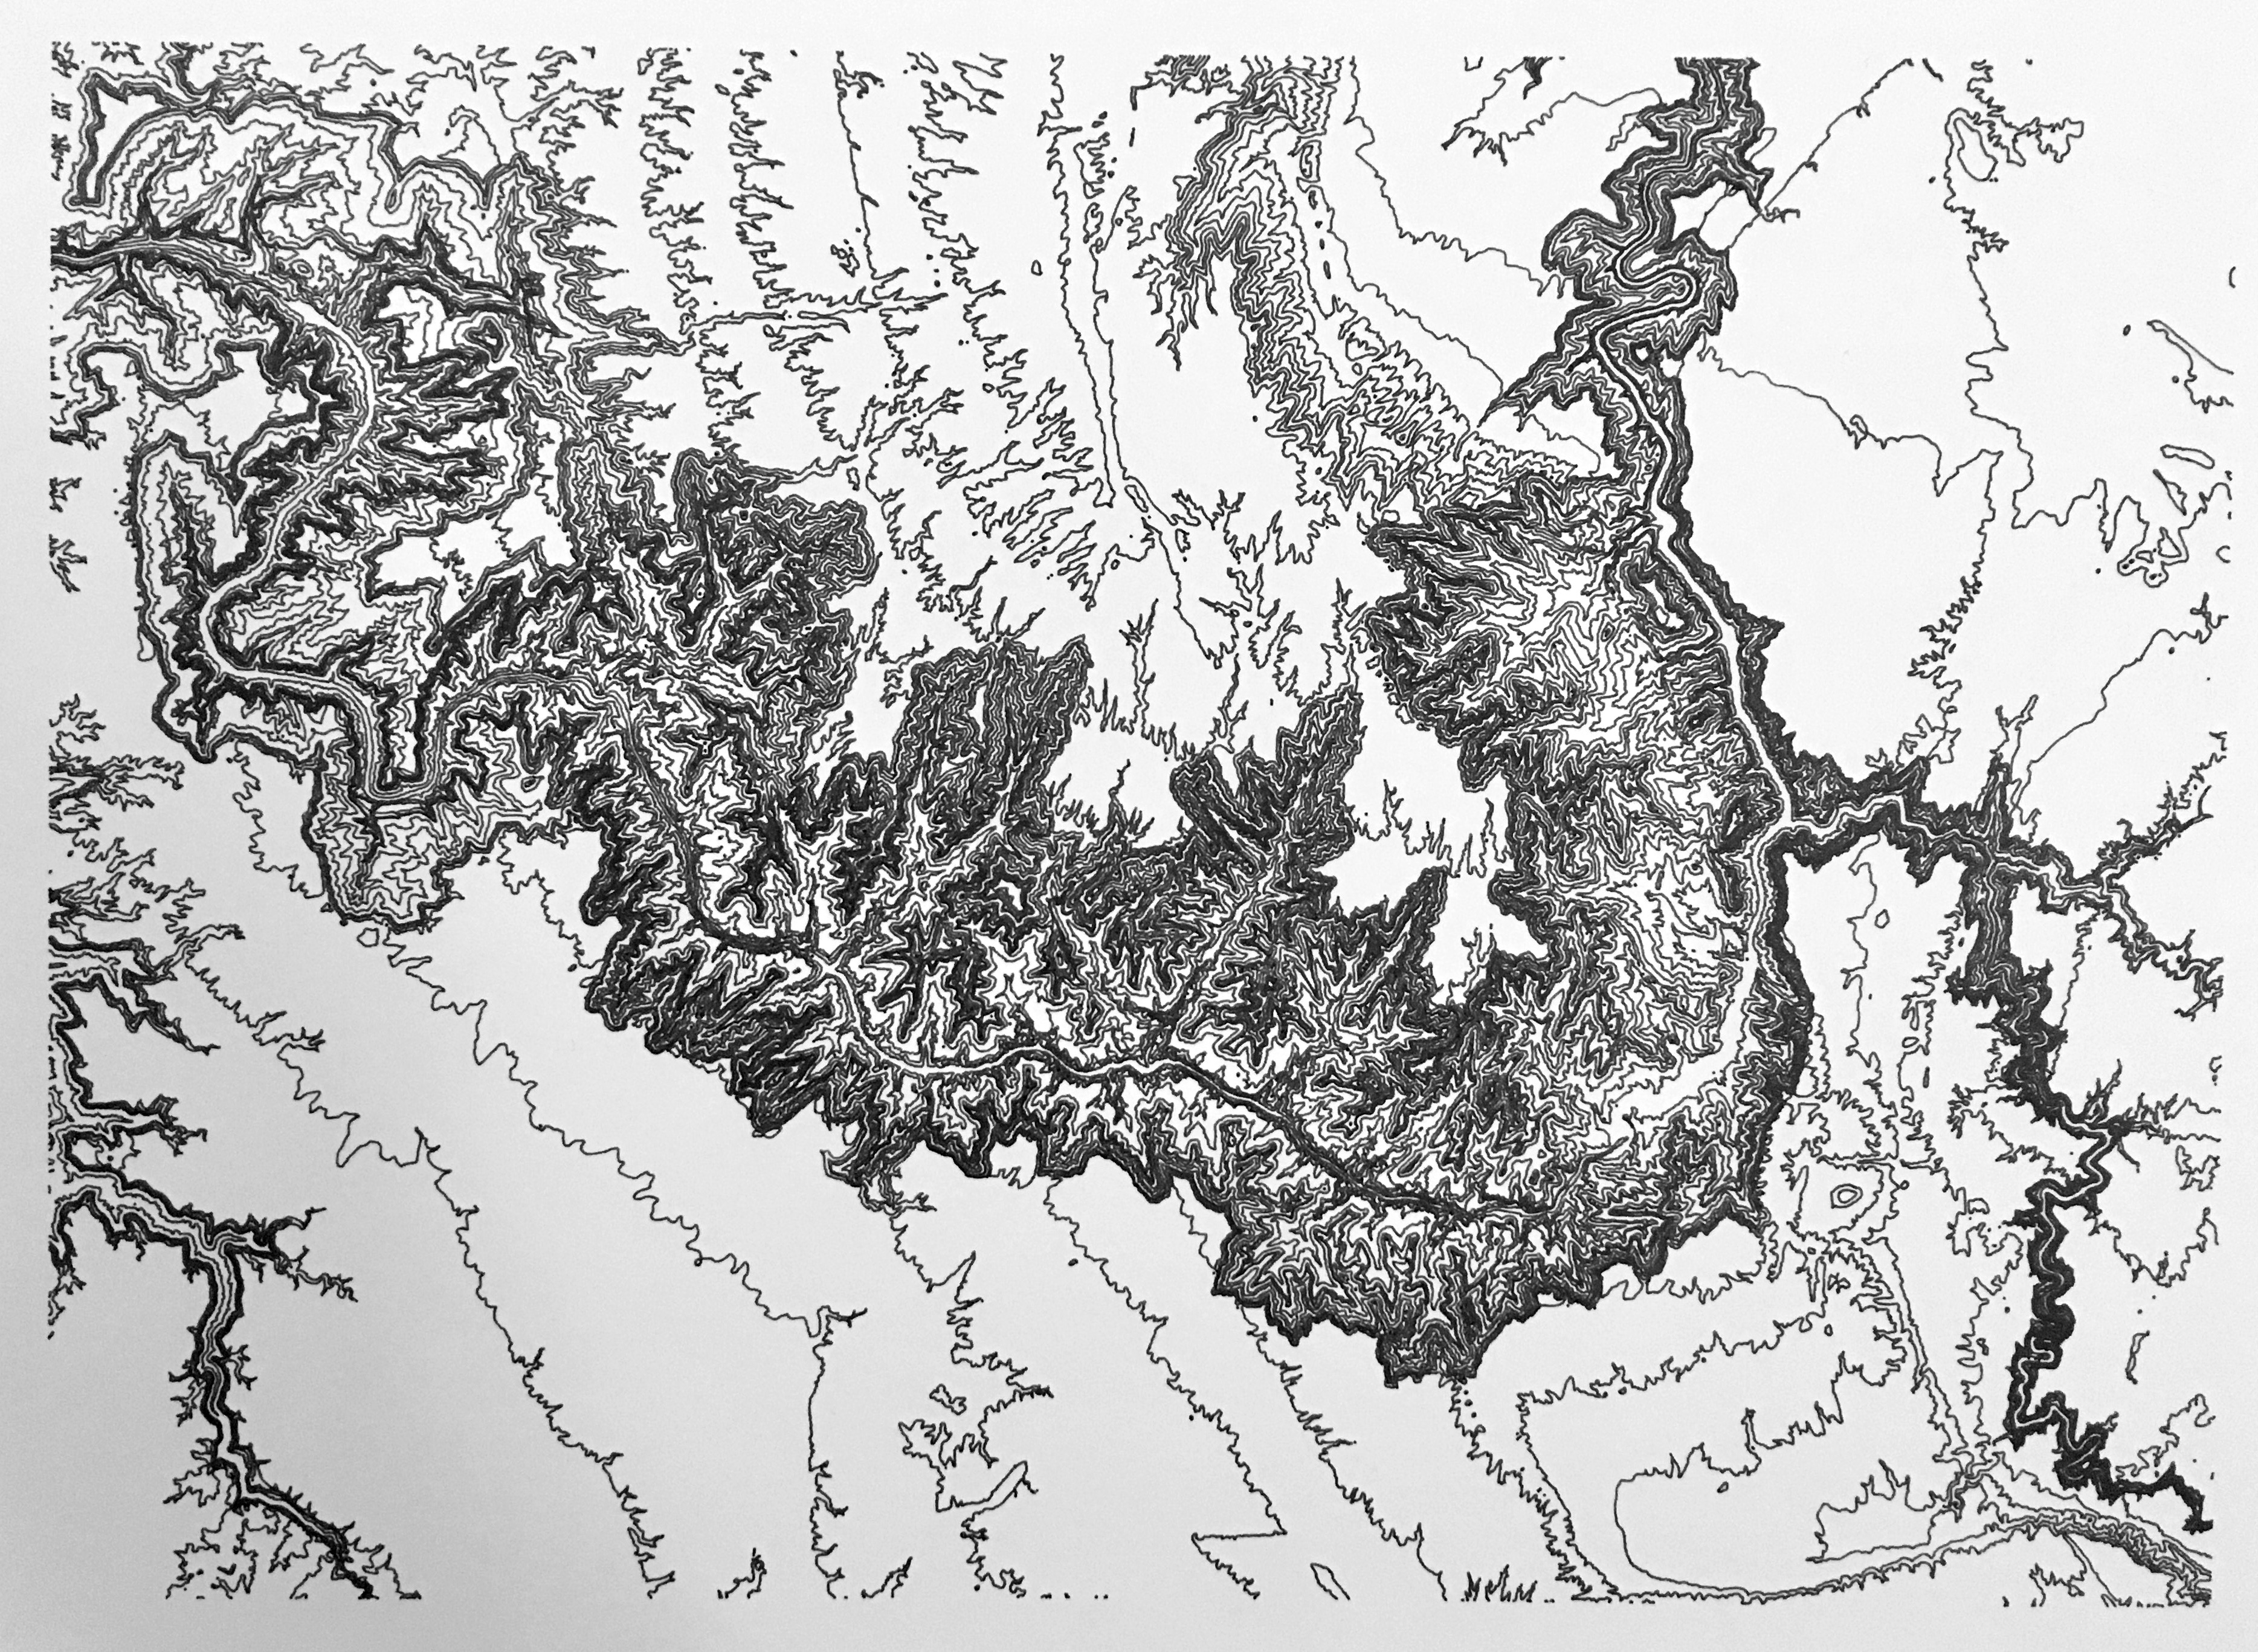
After downloading the DTM file (~600 MB) from the HiRISE gallery, I followed the process outlined in this excellent tutorial, ‘ Using QGIS to Make Custom Contour Maps’.
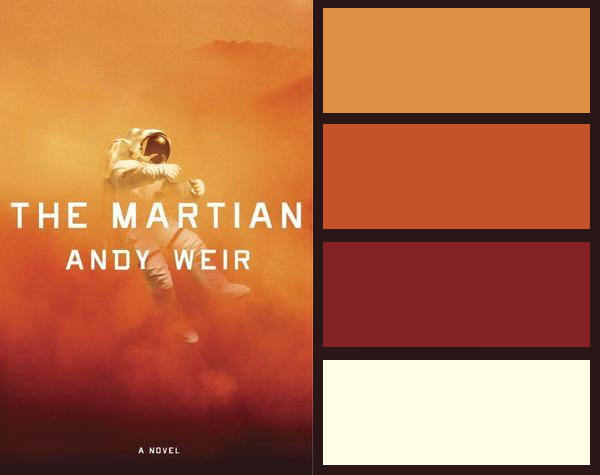
For the contour colour variation, I wanted to use a colour palette that had a specific Mars theme to it. I came across this really nice, simple palette that is based on the book cover for “The Martian” by Andy Weir.
 Next Page Please
Using the Digital Color Meter application in macOS, I copied the hex colour values for each of the four colors in the palette (#D57B35, #B53E21, #6E161C, #FFFFE1).
Next, I used the Layer Properties editor in QGIS to create a custom, continuous colour palette based on this colour palette.
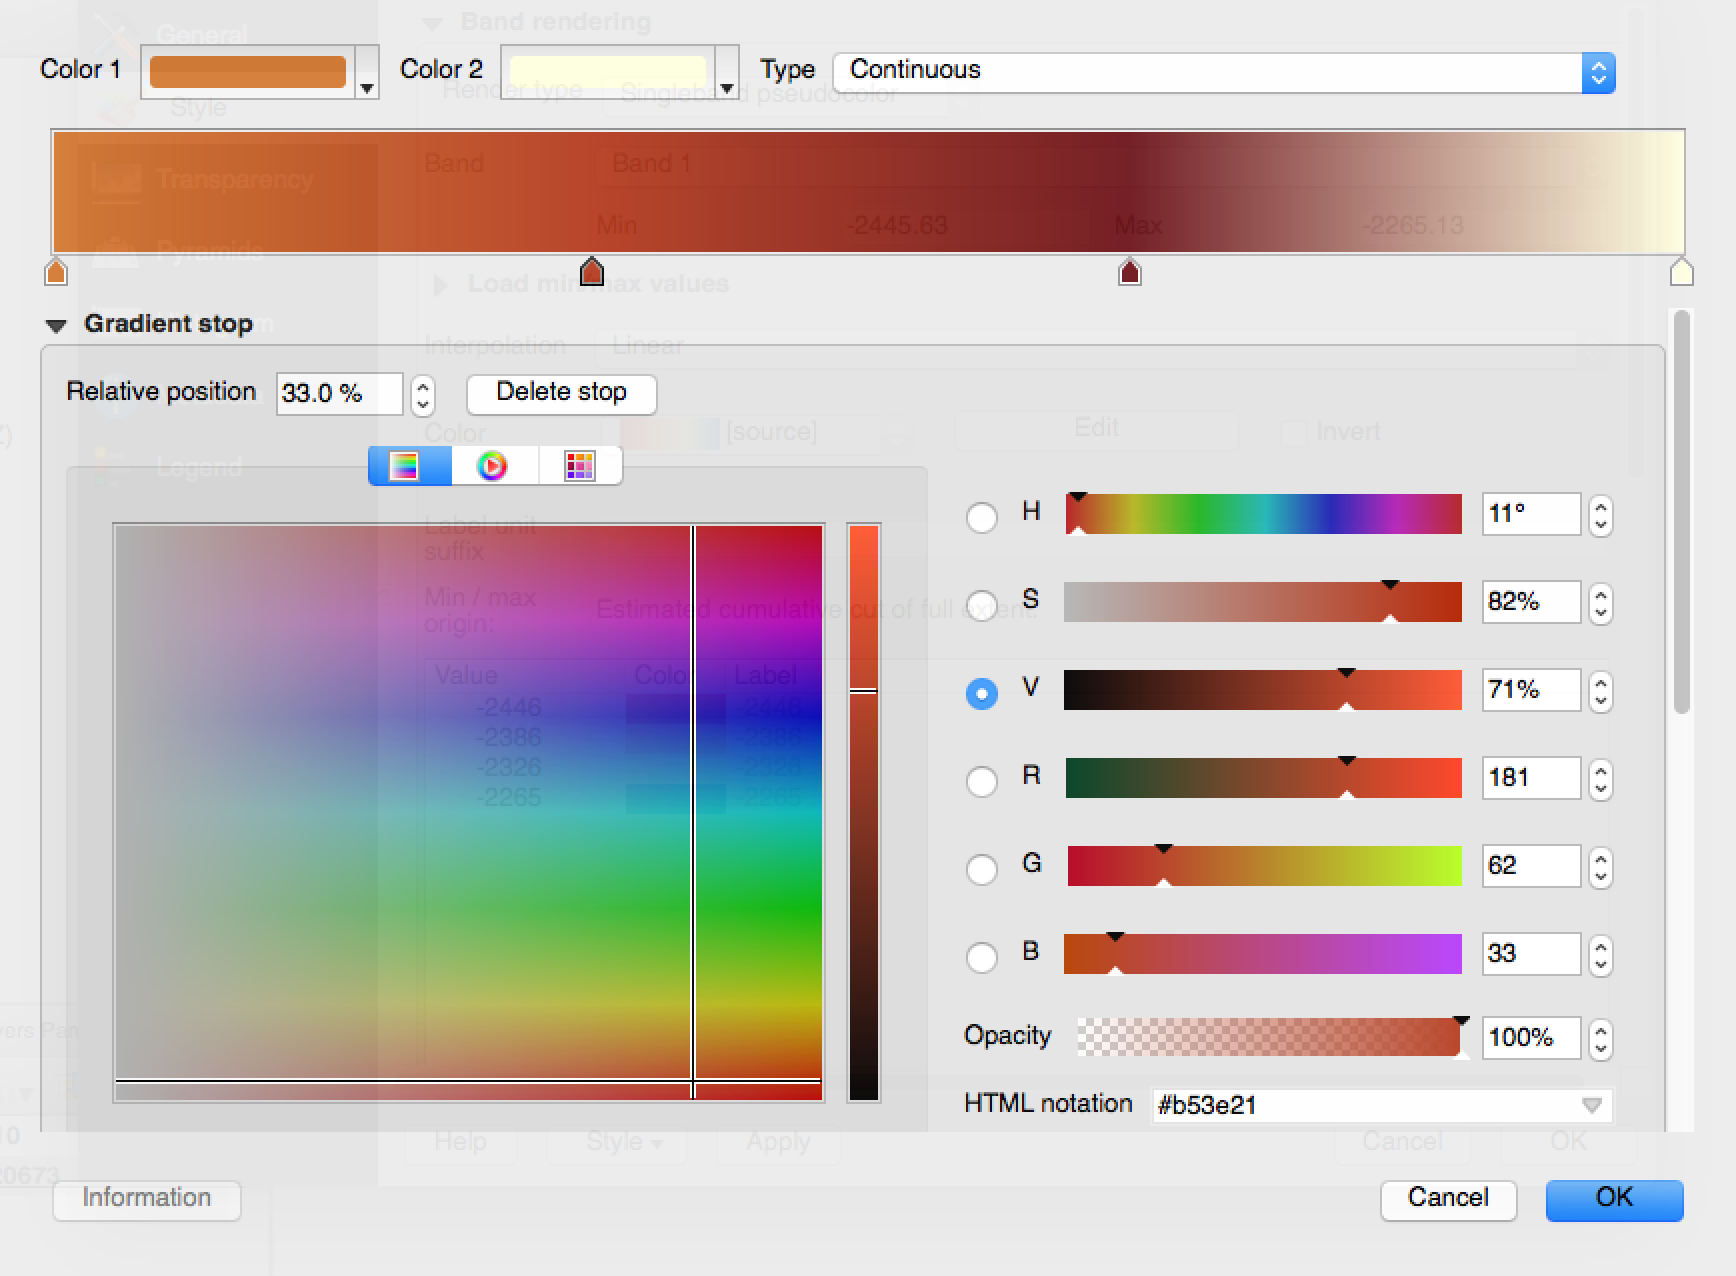
I edited the gradient stops down to only use four stops, spacing them at 0%/33.3%/66.6%/100% and then setting their color values to match the Martian book palette colours.
Image
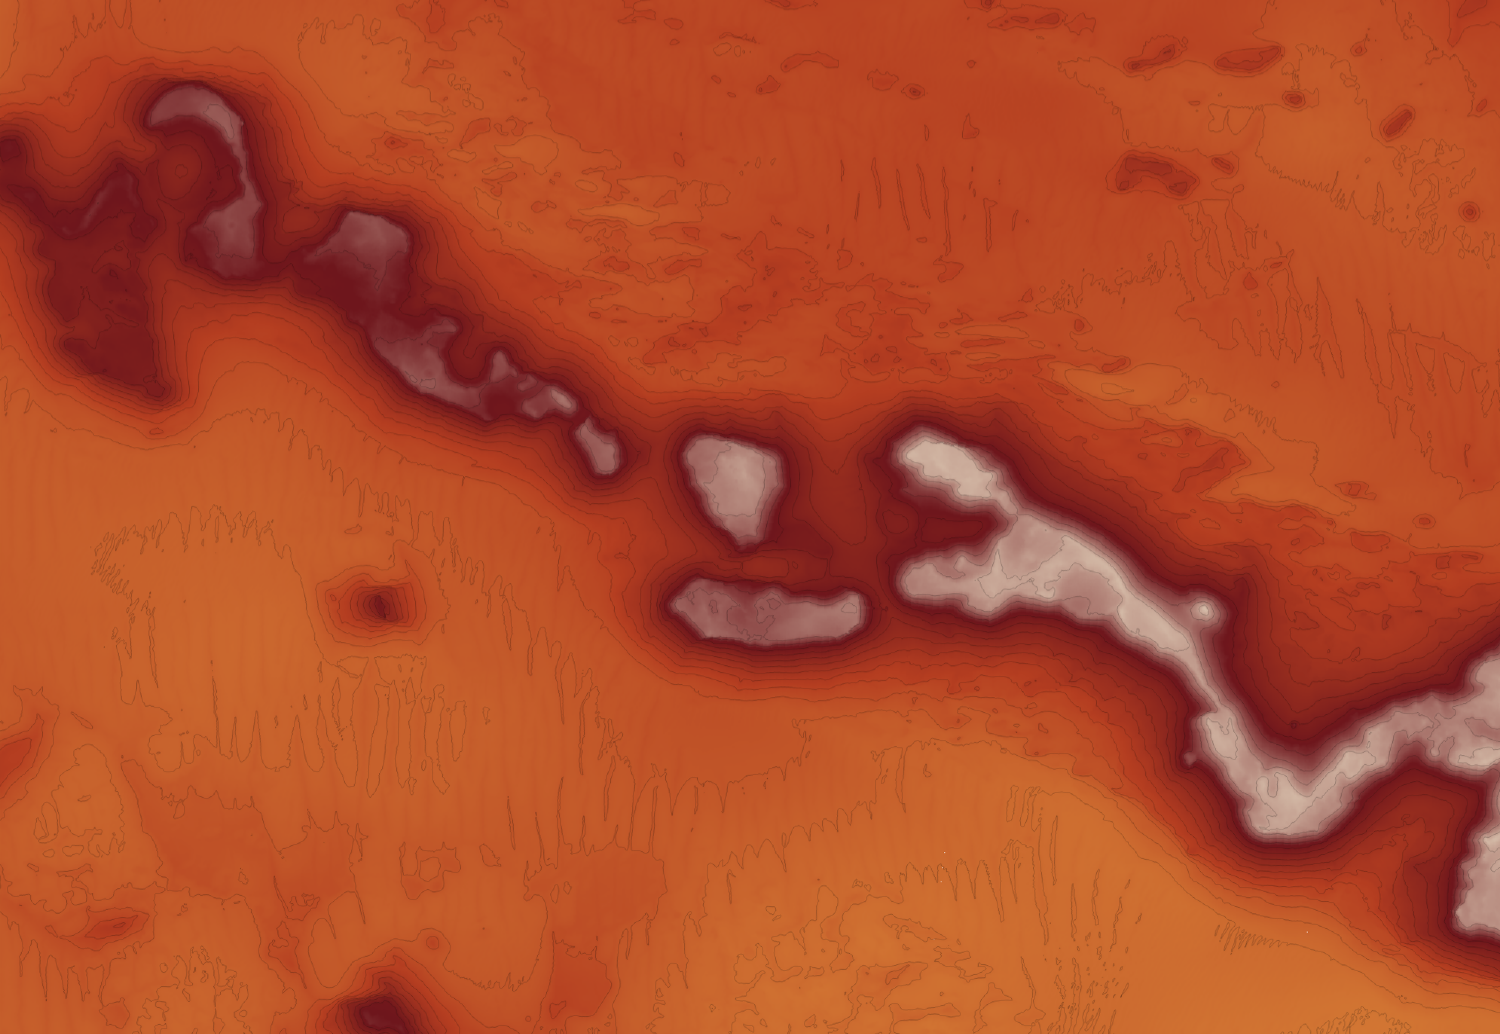
And after a bit of fiddling to export a nice png image, here’s the result!
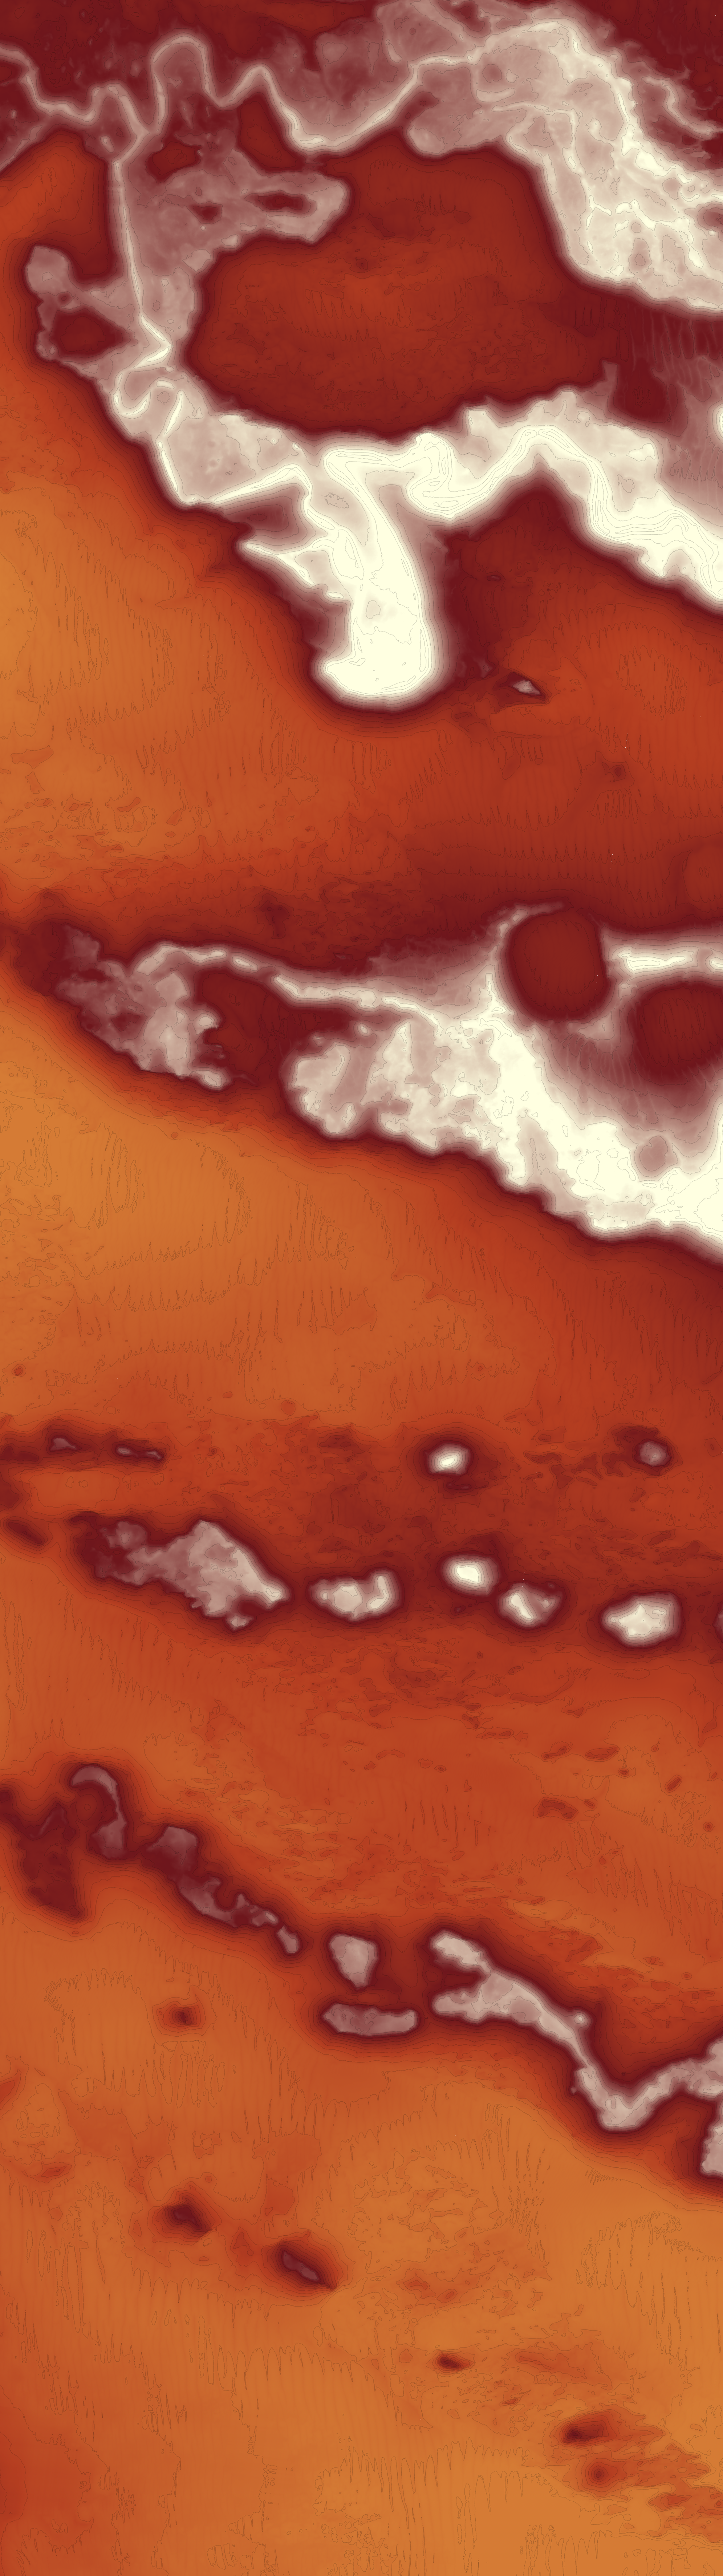
I’m really happy with the look of this image, especially the colour palette! It needs a bit of work on the contour line thickness and I should probably clip the image boundary down to a straight box line. I’ll definitely be trying some other images from Mars, and I’d even like to try this process with DTM’s from other planets too!
- Posted on:
- February 26, 2018
- Length:
- 3 minute read, 504 words
- Categories:
- Tutorials
- Tags:
- topography mars
- See Also:
- Mars Contours